Fig. 14.
Download original image
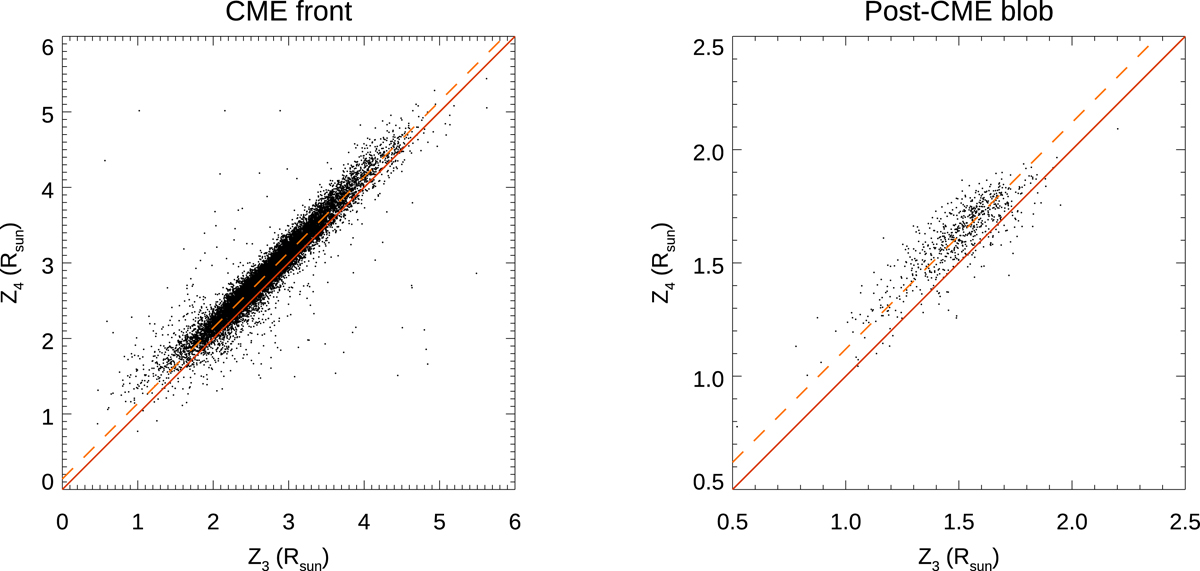
Scatter plot comparisons between the distributions of LoS positions as obtained with the polarization ratio technique applied to the same Metis data points using four (Z4) and three (Z3) different orientations of the linear polarizer for the CME front (left) and the post-CME blob (right). The solid lines show the reference curve for Z4 = Z3, and the dashed lines show the best fit.
Current usage metrics show cumulative count of Article Views (full-text article views including HTML views, PDF and ePub downloads, according to the available data) and Abstracts Views on Vision4Press platform.
Data correspond to usage on the plateform after 2015. The current usage metrics is available 48-96 hours after online publication and is updated daily on week days.
Initial download of the metrics may take a while.