Free Access
Fig. 13.
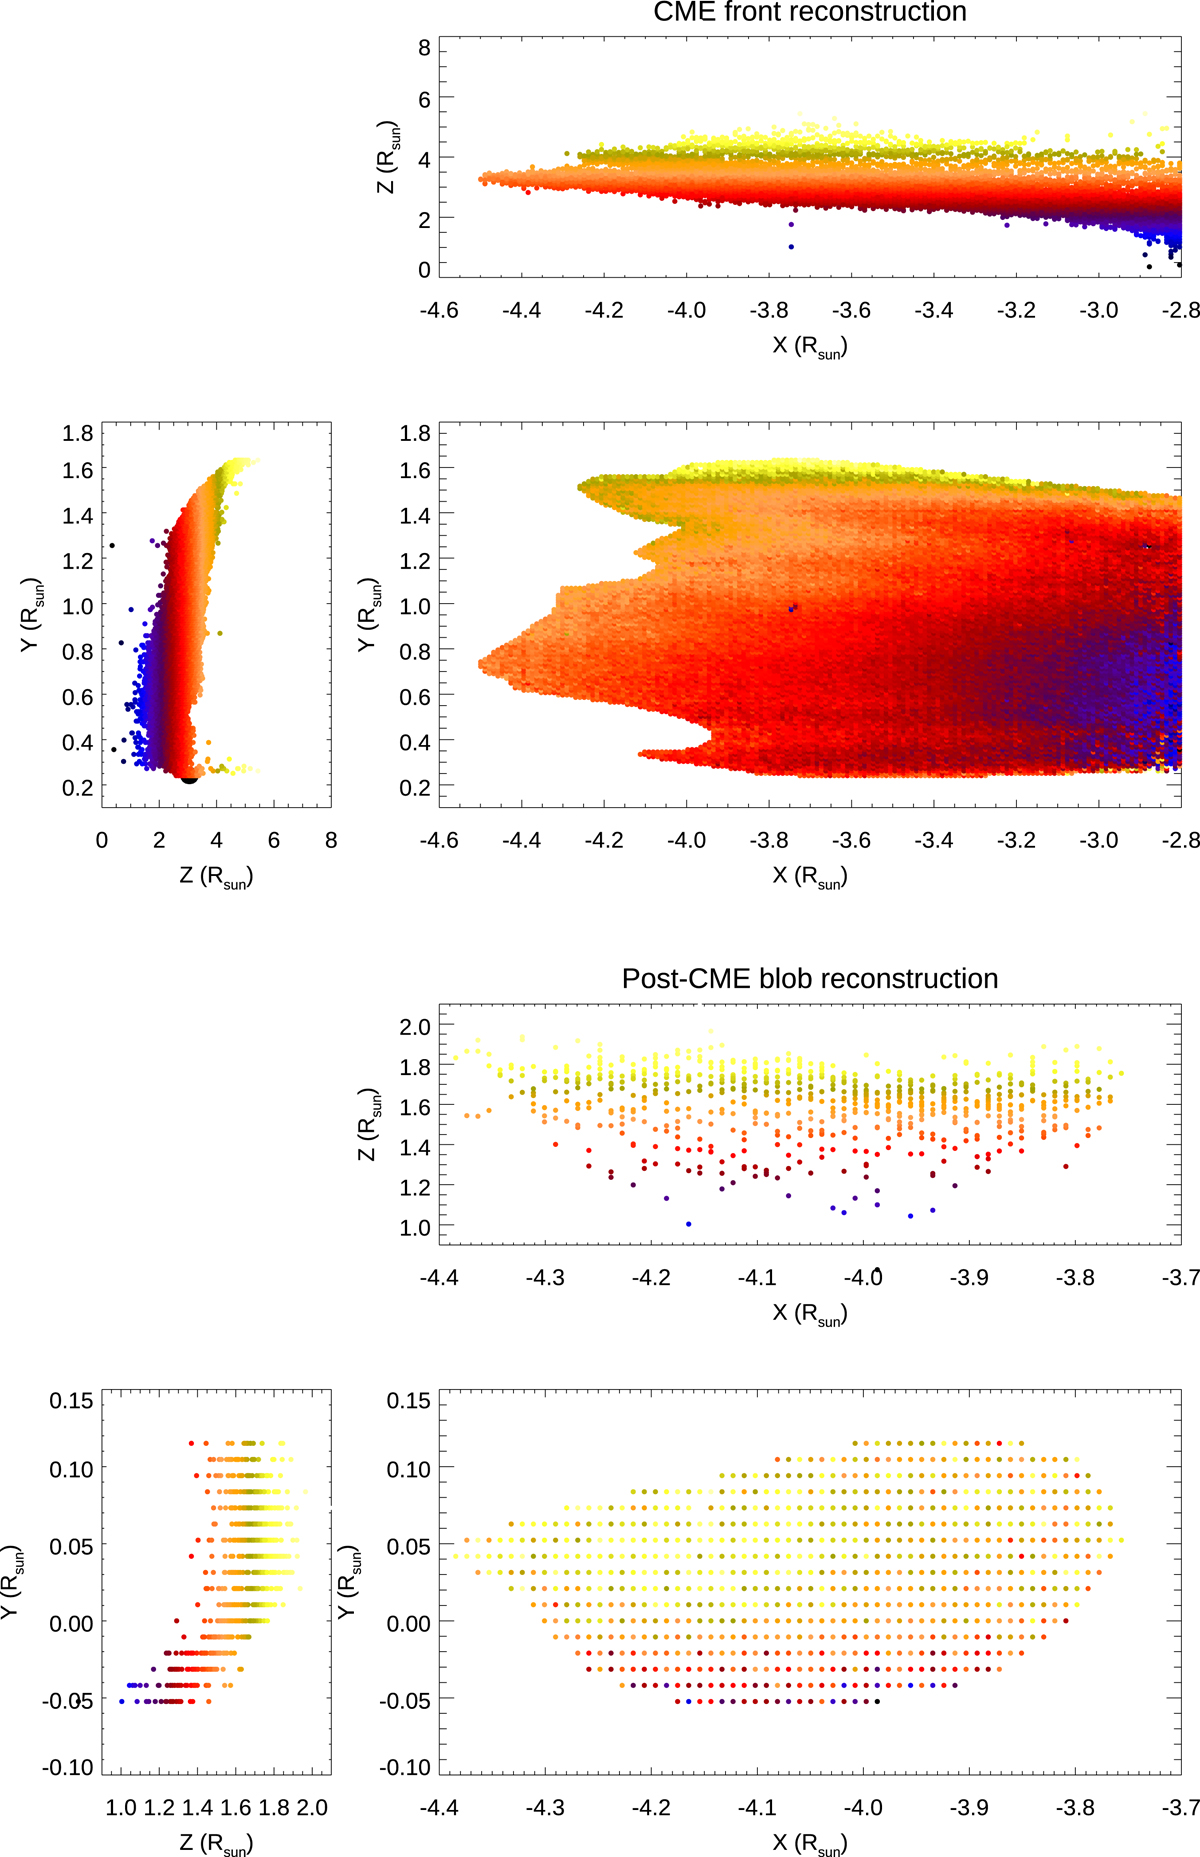
Download original image
3D distribution of plasma-emitting elements as obtained from the polarization ratio technique applied to the VL Metis observations of the CME front (top panels) and the post-CME blob (bottom panels). Different colors correspond to different distances from the PoS (located at Z = 0) as given in the left panels.
Current usage metrics show cumulative count of Article Views (full-text article views including HTML views, PDF and ePub downloads, according to the available data) and Abstracts Views on Vision4Press platform.
Data correspond to usage on the plateform after 2015. The current usage metrics is available 48-96 hours after online publication and is updated daily on week days.
Initial download of the metrics may take a while.