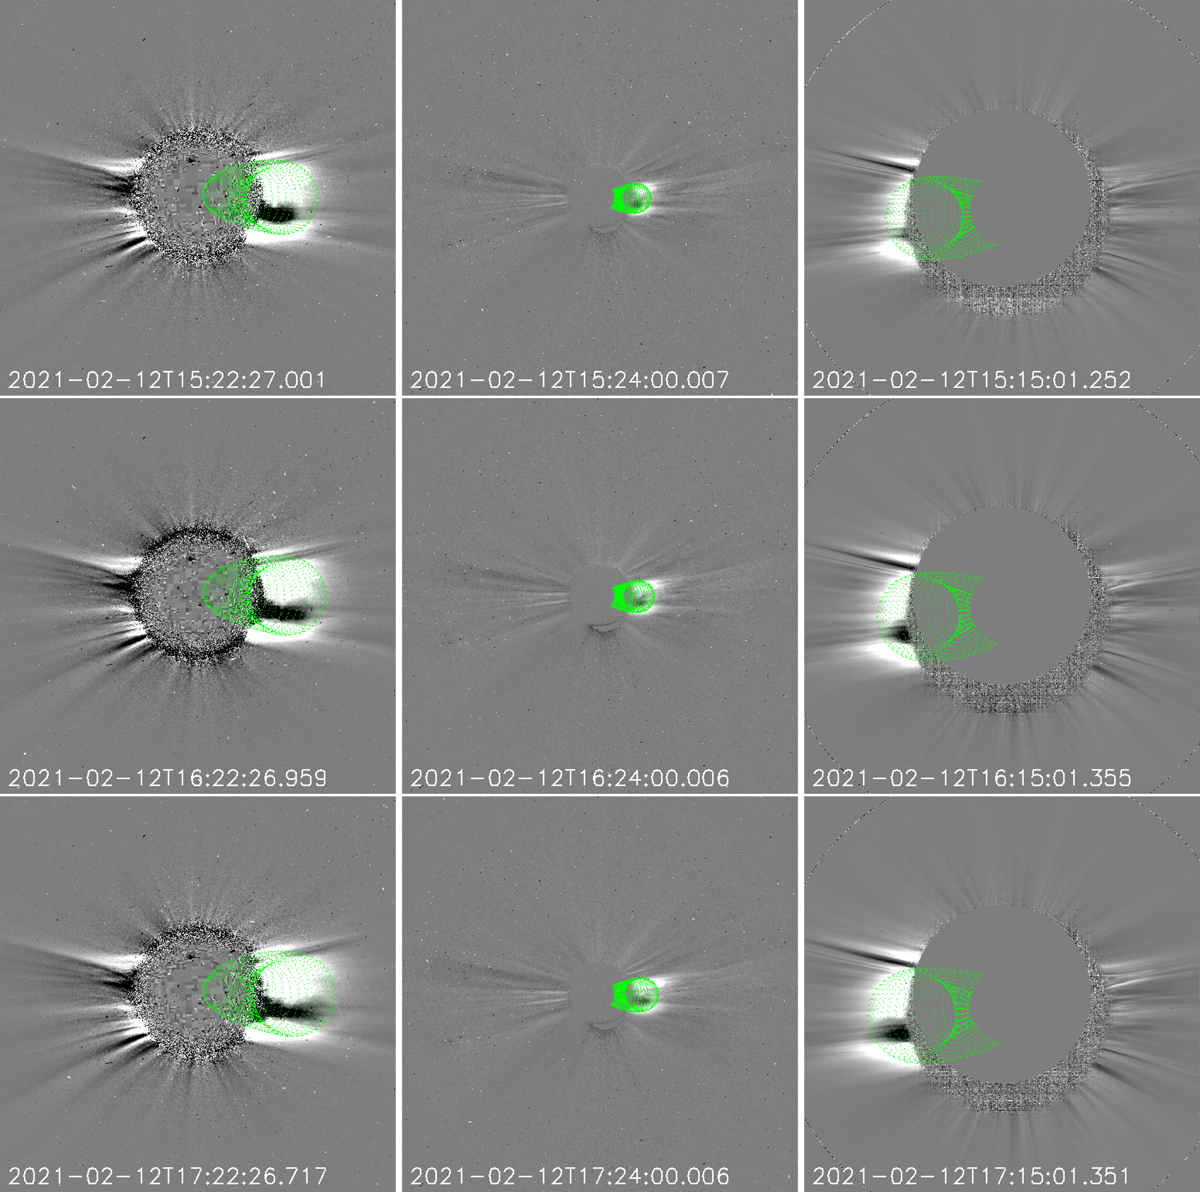
Fig. 12.
Download original image
The February 12 CME as observed by coronagraphs on board different spacecraft at different times. Upper row: GCS reconstruction of the CME on February 12 observed by LASCO-C2 at 15:22–07:58 UT (left panel), by COR2-A at 15:24–08:24 UT (middle panel), and by Metis at 15:15–12:15 UT (right panel). Middle row: GCS reconstruction of the CME on February 12 observed by LASCO-C2 at 16:22–07:58 UT (left panel), by COR2-A at 16:24–08:24 UT (middle panel), and by Metis at 16:15–12:15 UT (right panel). Lower row: GCS reconstruction of the CME on February 12 observed by LASCO-C2 at 17:22–07:58 UT (left panel), by COR2-A at 17:24–08:24 UT (middle panel), and by Metis at 17:15–12:15 UT (right panel).
Current usage metrics show cumulative count of Article Views (full-text article views including HTML views, PDF and ePub downloads, according to the available data) and Abstracts Views on Vision4Press platform.
Data correspond to usage on the plateform after 2015. The current usage metrics is available 48-96 hours after online publication and is updated daily on week days.
Initial download of the metrics may take a while.