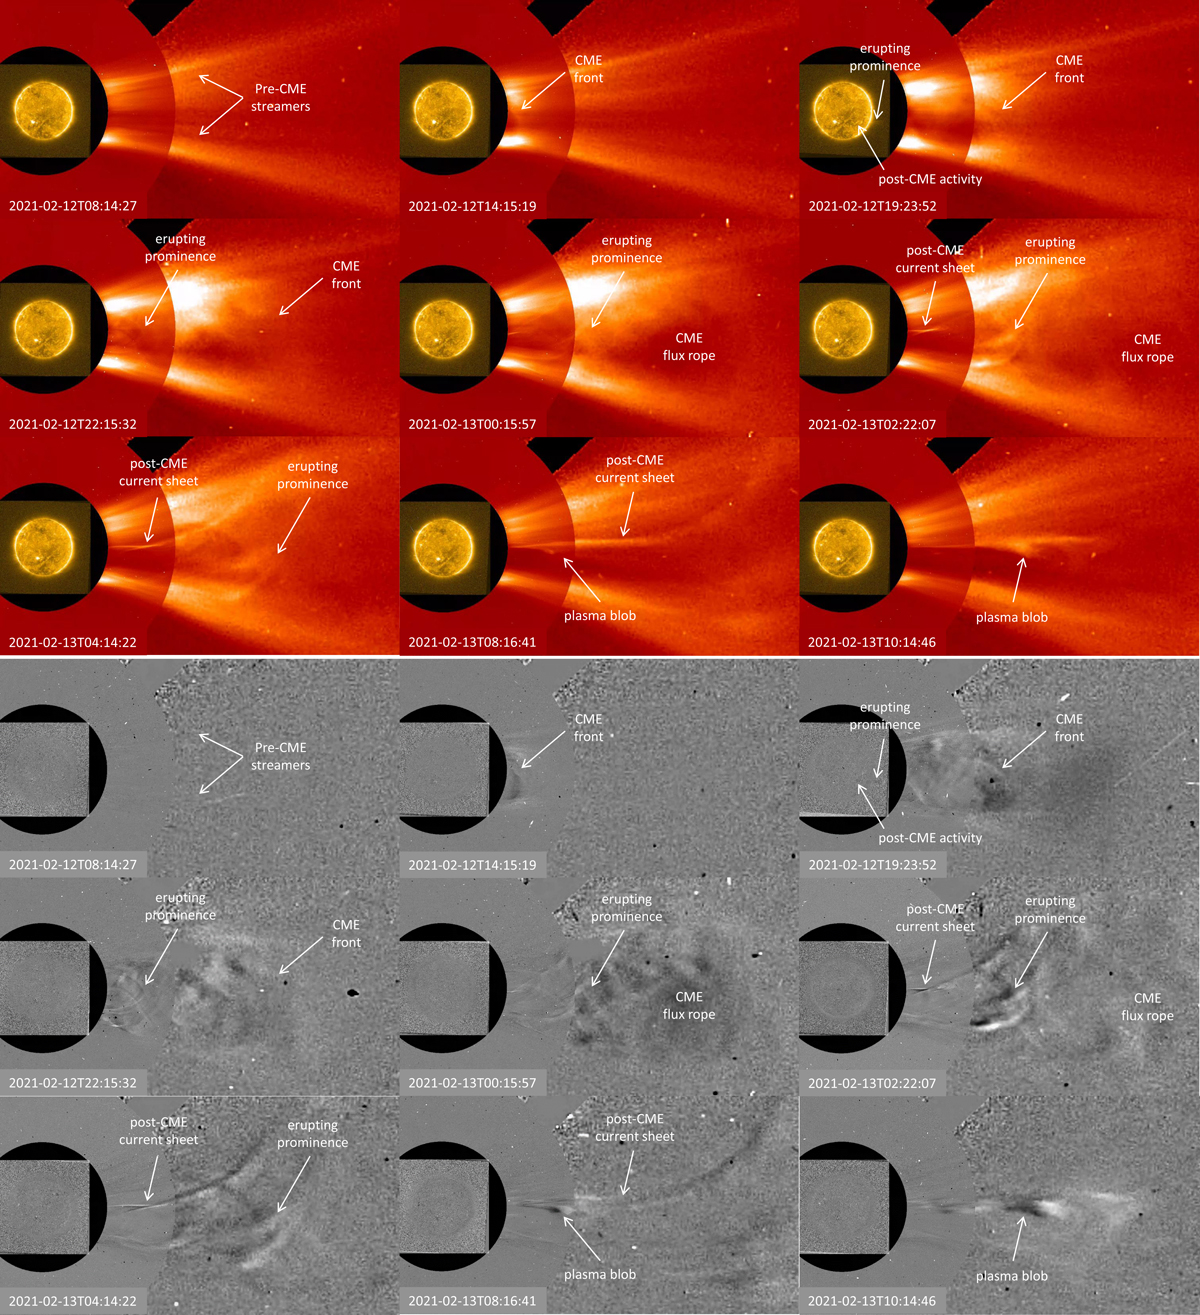
Fig. 1.
Download original image
Complex sequence of events between 2021 February 12 and 13 as shown by the PROBA2/SWAP imager and SOHO/LASCO-C2 and C3 coronagraphs (see text). The top panel shows intensity images, and the bottom panel shows the corresponding running difference images. All these combined images have been created with JHelioviewer (Müller et al. 2017).
Current usage metrics show cumulative count of Article Views (full-text article views including HTML views, PDF and ePub downloads, according to the available data) and Abstracts Views on Vision4Press platform.
Data correspond to usage on the plateform after 2015. The current usage metrics is available 48-96 hours after online publication and is updated daily on week days.
Initial download of the metrics may take a while.