Fig. 6
Download original image
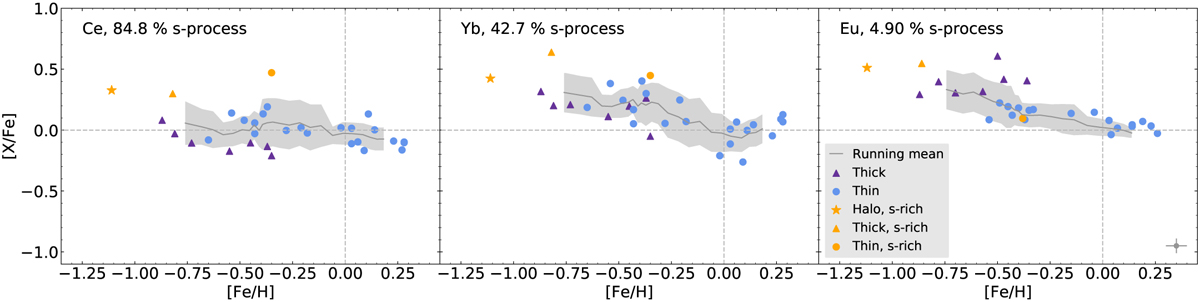
Comparison between the [Ce/Fe] (left) and [Yb/Fe] abundances (middle) derived in this work and [Eu/Fe] abundances (right) from Forsberg et al. (2019). The stellar populations are indicated by colour and shape (see the legend), with the s-process-enhanced stars in yellow. The percentage of contribution from the s-process from Prantzos et al. (2020) is indicated in the top-left corner of each plot. The running mean with a 1σ error (grey) has a running box with a size of eight stars, roughly 25% of the sample size. In the lower-right corner of the [Eu/Fe] plot, the typical uncertainty from Forsberg et al. (2019) is indicated. Dashed grey lines going through [0,0] indicate the solar value.
Current usage metrics show cumulative count of Article Views (full-text article views including HTML views, PDF and ePub downloads, according to the available data) and Abstracts Views on Vision4Press platform.
Data correspond to usage on the plateform after 2015. The current usage metrics is available 48-96 hours after online publication and is updated daily on week days.
Initial download of the metrics may take a while.