Fig. 9.
Download original image
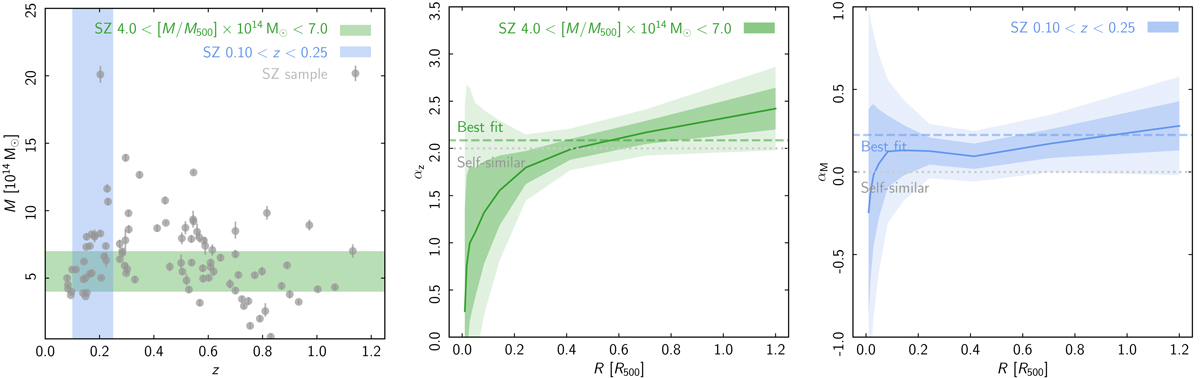
Deviations from the average scaling with radius. Left: redshift-mass distribution of the SZE-selected sample used in this work. The shaded regions indicate cuts for two sub-samples: a large redshift range at nearly fixed mass, and a large mass range at nearly fixed redshift. Middle: degree to which the radial ICM density profile evolves as a function of redshift at nearly fixed mass. The dotted line shows the self-similar expectation (αz = 2). The dashed line shows the best-fitting evolution, which varies from slower than self-similar in the centre (αz ∼ 0.3) to faster than self-similar around R500 (αz ∼ 2.4). Envelopes show the 1 and 2σ uncertainties. Right: degree to which the radial ICM density profile scales with mass at nearly fixed redshift. The dotted line shows the self-similar expectation (αz = 0). The dashed line shows the best-fitting mass dependence of αz = 0.22. The scaled density at nearly fixed redshift does not depend on radius.
Current usage metrics show cumulative count of Article Views (full-text article views including HTML views, PDF and ePub downloads, according to the available data) and Abstracts Views on Vision4Press platform.
Data correspond to usage on the plateform after 2015. The current usage metrics is available 48-96 hours after online publication and is updated daily on week days.
Initial download of the metrics may take a while.