Fig. 8.
Download original image
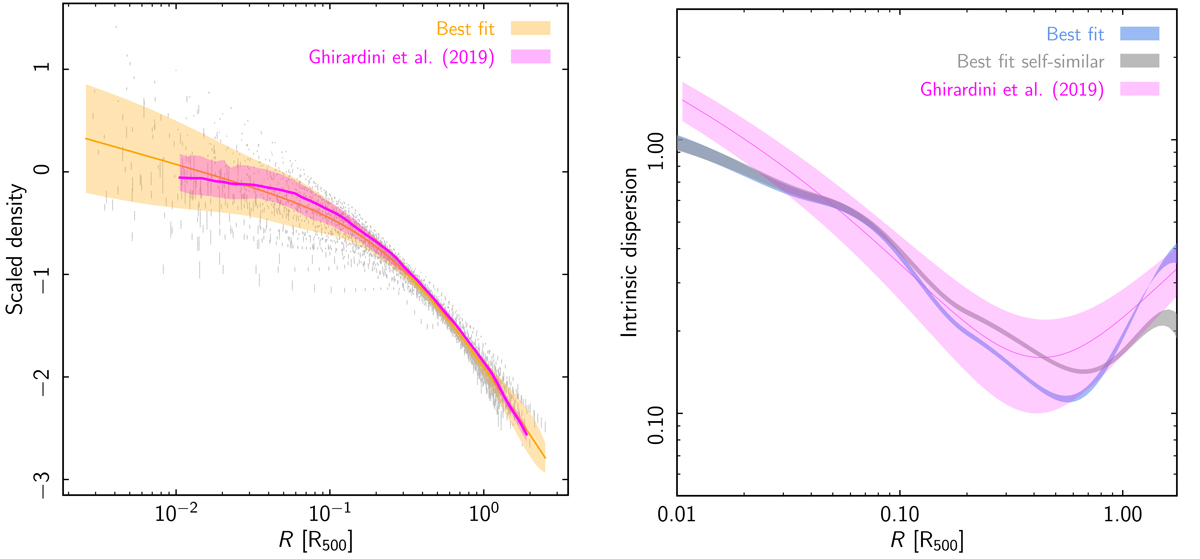
Scaled density profiles. Left: scaled density profiles (points) and best-fitting model (orange envelope) for SZE-selected systems in our sample compared to the median and 68% dispersion from the X-COP sample (Ghirardini et al. 2019, magenta envelope). Right: comparison of best fitting intrinsic scatter model (blue) with that found by Ghirardini et al. (2019, magenta). The best-fitting intrinsic scatter obtained from our sample when the evolution factor is forced to the self-similar value of E(z)2 is also shown in grey.
Current usage metrics show cumulative count of Article Views (full-text article views including HTML views, PDF and ePub downloads, according to the available data) and Abstracts Views on Vision4Press platform.
Data correspond to usage on the plateform after 2015. The current usage metrics is available 48-96 hours after online publication and is updated daily on week days.
Initial download of the metrics may take a while.