Fig. 7.
Download original image
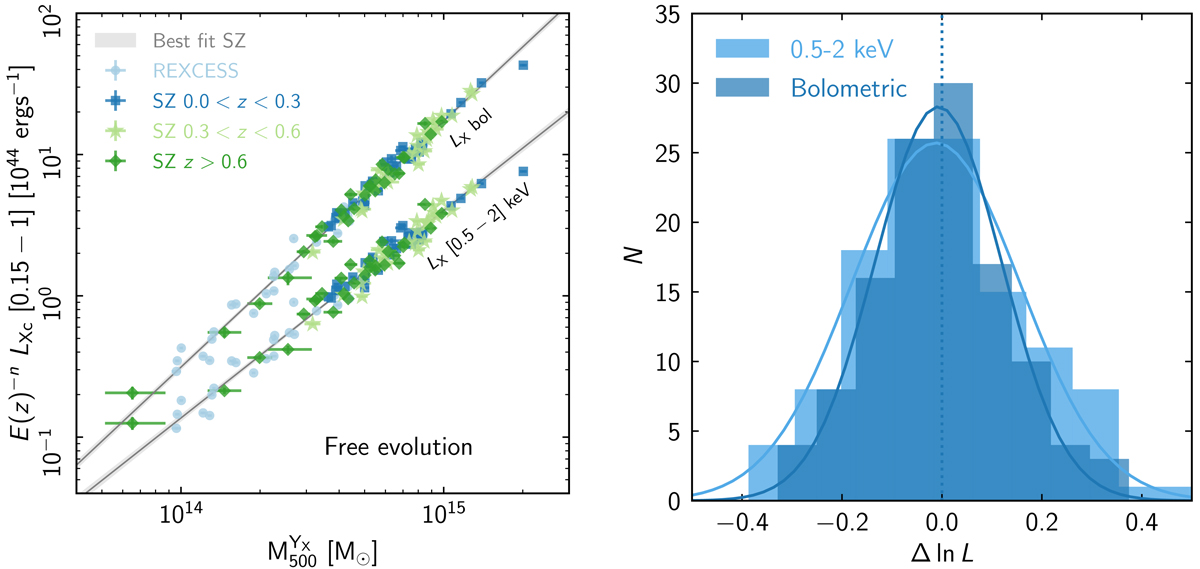
Relation between the core-excised X-ray luminosity LXc and mass estimated from the YX proxy, for the bolometric and soft-band luminosities of 118 systems. Left: best fitting relation (grey envelope) to the full sample (data points) with the evolution factor n left free to vary. The best-fitting values of n are given in Table 2. Right: histogram of the log space residuals from the best fitting relation. Solid lines show the best-fitting Gaussian distributions with σ corresponding to the best-fitting intrinsic scatter in log space (Table 2).
Current usage metrics show cumulative count of Article Views (full-text article views including HTML views, PDF and ePub downloads, according to the available data) and Abstracts Views on Vision4Press platform.
Data correspond to usage on the plateform after 2015. The current usage metrics is available 48-96 hours after online publication and is updated daily on week days.
Initial download of the metrics may take a while.