Fig. 2.
Download original image
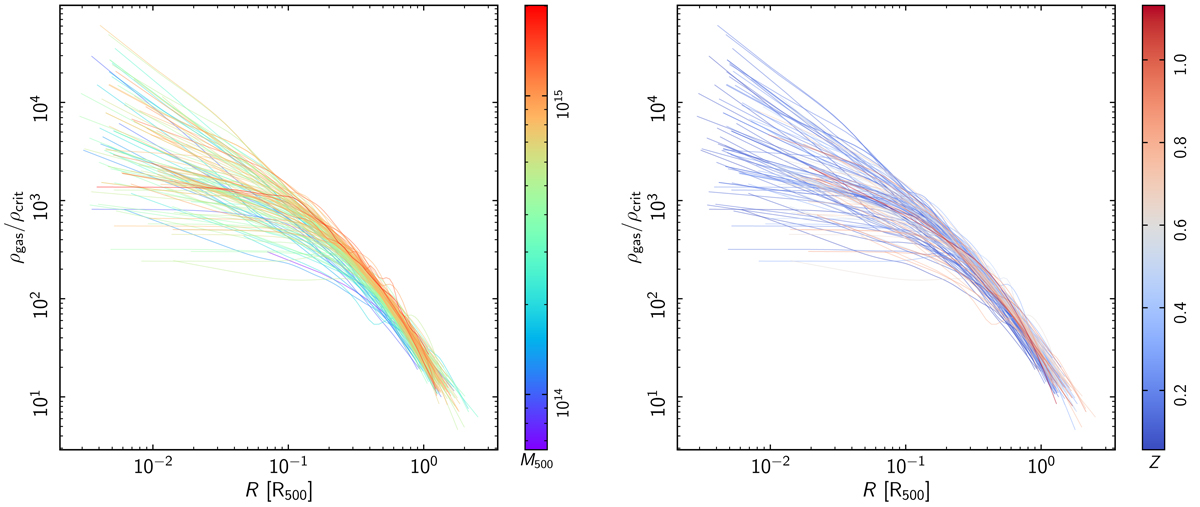
Deprojected, PSF-corrected density profiles for 118 galaxy clusters, normalised by the critical density ρcrit and R500. Fully self-similar clusters would trace the same locus in this plot. The profiles are colour-coded by mass M500 in the left-hand panel, and by redshift z in the right-hand panel. There are clear trends with respect to both quantities.
Current usage metrics show cumulative count of Article Views (full-text article views including HTML views, PDF and ePub downloads, according to the available data) and Abstracts Views on Vision4Press platform.
Data correspond to usage on the plateform after 2015. The current usage metrics is available 48-96 hours after online publication and is updated daily on week days.
Initial download of the metrics may take a while.