Fig. C.1.
Download original image
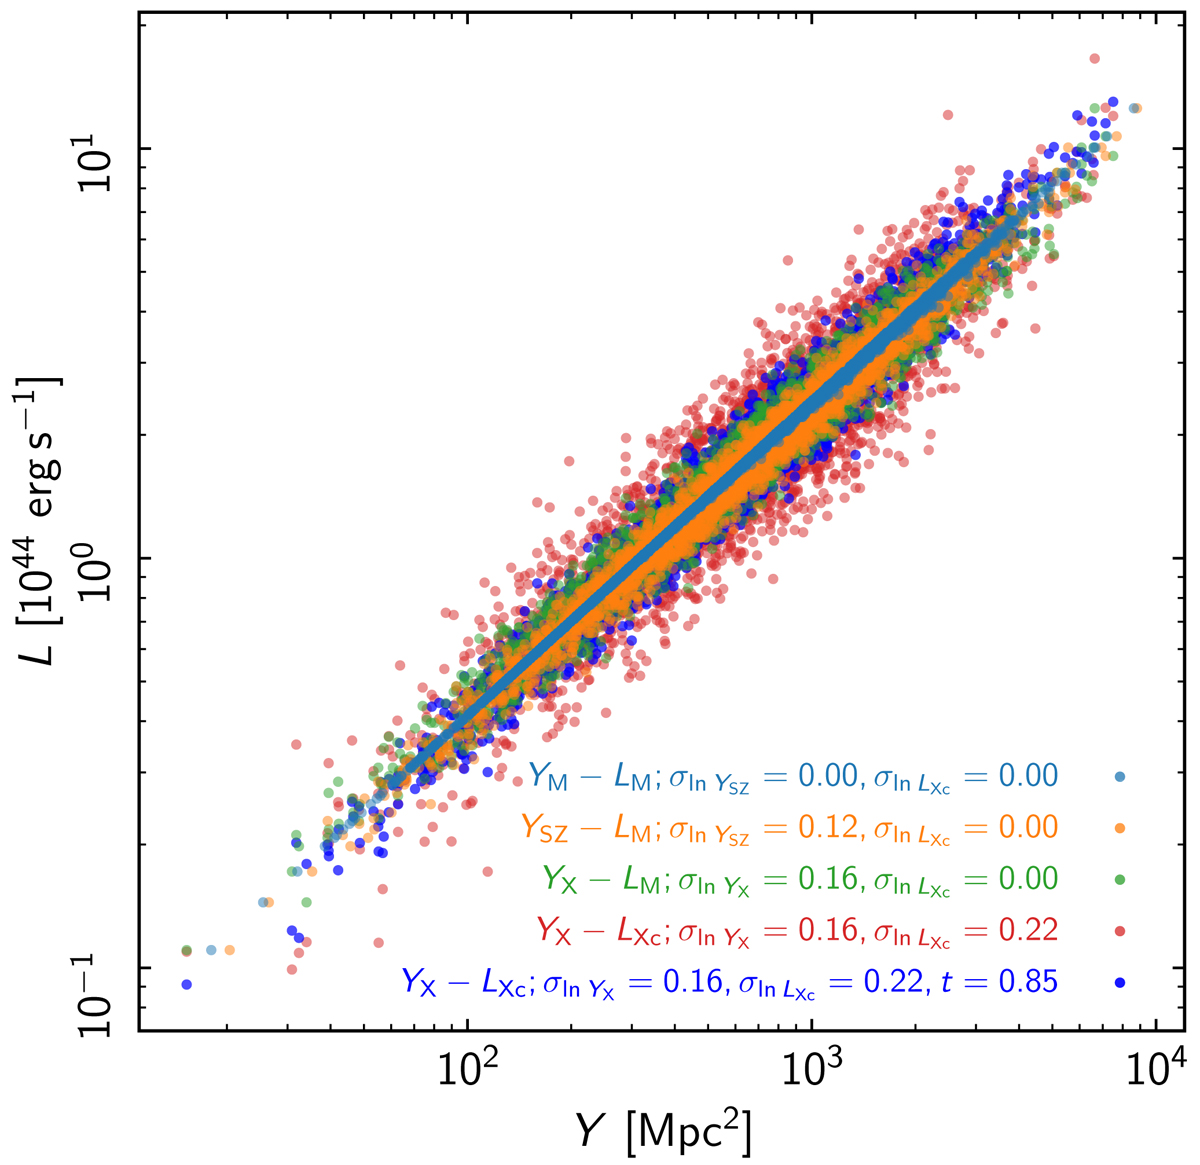
Simulated YSZ reextracted from PSZ2 maps, plotted as a function of LXc. The quantity 𝒬M is the latent variable with respect to the mass M, obtained if there were no scatter in the relation. The Figure shows the effect of progressively adding scatter in YSZ, YX, and LXc with M. The blue points include covariance of t = 0.85 between YX and LXc.
Current usage metrics show cumulative count of Article Views (full-text article views including HTML views, PDF and ePub downloads, according to the available data) and Abstracts Views on Vision4Press platform.
Data correspond to usage on the plateform after 2015. The current usage metrics is available 48-96 hours after online publication and is updated daily on week days.
Initial download of the metrics may take a while.