Fig. 11.
Download original image
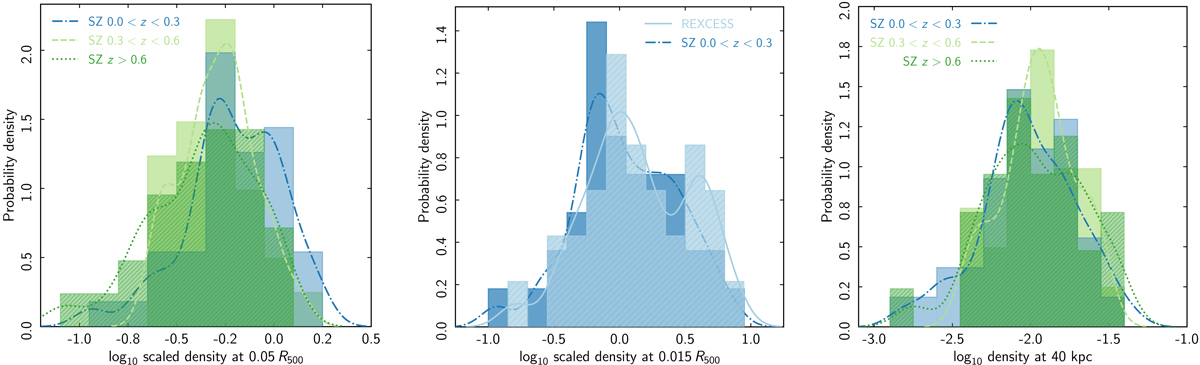
Central density. Left: histogram of central densities for the SZE-selected systems, scaled according to the best-fitting model (Eq. (17)) derived in Sect. 3.2, measured at 0.05 R500. The solid line is a kernel density plot with a smoothing width of 0.15. Middle: histogram of scaled central densities for the z < 0.3 SZE-selected systems compared to the X-ray-selected sample, measured at 0.015 R500. The solid line is a kernel density plot with a smoothing width of 0.15. Right: histogram of central densities for the SZE-selected sample at 40 kpc.
Current usage metrics show cumulative count of Article Views (full-text article views including HTML views, PDF and ePub downloads, according to the available data) and Abstracts Views on Vision4Press platform.
Data correspond to usage on the plateform after 2015. The current usage metrics is available 48-96 hours after online publication and is updated daily on week days.
Initial download of the metrics may take a while.