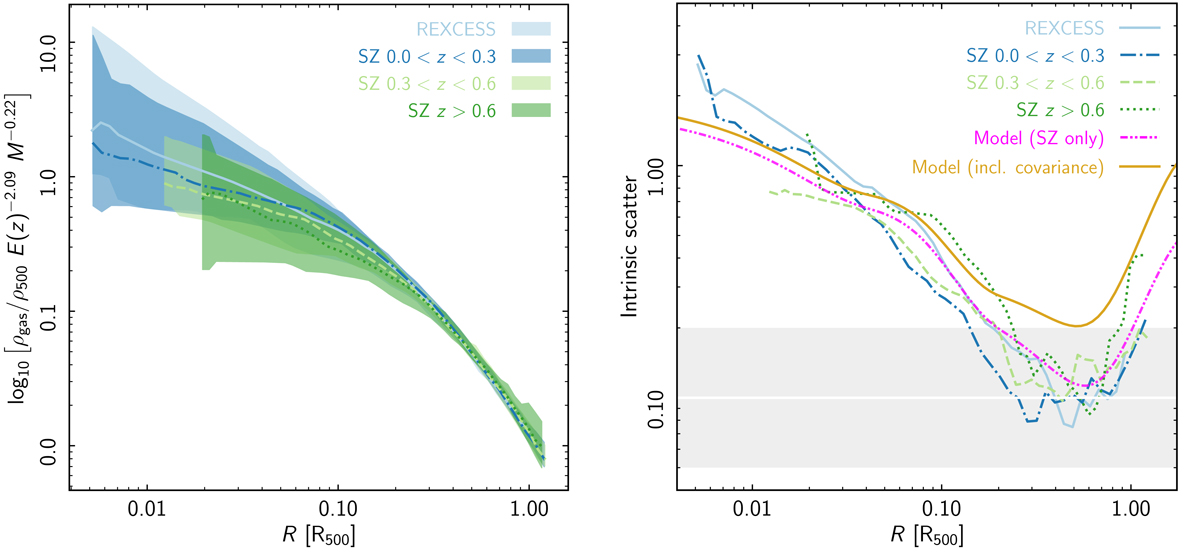
Fig. 10.
Download original image
Scaled profiles and scatter. Left: median scaled profiles (solid lines) and 68% scatter (envelopes) for REXCESS and the SZE-selected sample split into three redshift bins. Beyond ∼0.2 R500 the scaled profiles are almost indistinguishable. Right: radial profile of the intrinsic scatter for the various sub-samples. The best-fitting intrinsic scatter model obtained from the SZE-selected sample is also shown. Intrinsic scatter is less than 20% between 0.2 ≲ R500 ≲ 1.0. The gold line shows the model intrinsic scatter profile corrected for the covariance between Mgas and R500 (see Sect. 5.1.4), which results in a suppression of the scatter by a factor of about two at R500.
Current usage metrics show cumulative count of Article Views (full-text article views including HTML views, PDF and ePub downloads, according to the available data) and Abstracts Views on Vision4Press platform.
Data correspond to usage on the plateform after 2015. The current usage metrics is available 48-96 hours after online publication and is updated daily on week days.
Initial download of the metrics may take a while.