Open Access
Fig. 13.
Download original image
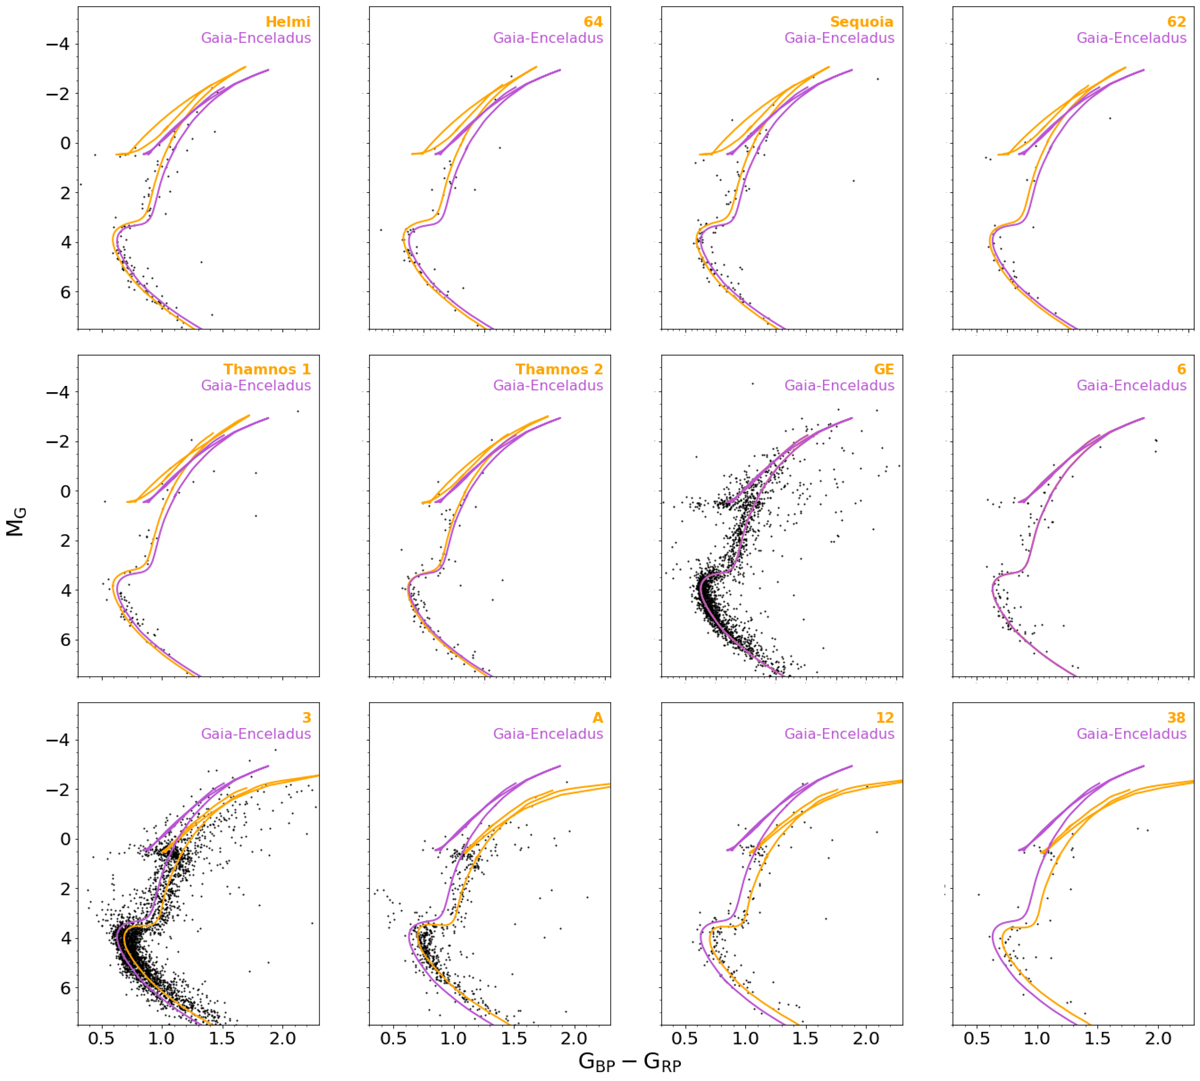
CaMDs for the 12 extended substructures identified in this work. We include the best isochrone from our isochrone-fitting approach (see Sect. 3.1) to each structure (orange solid line) as well as that for the combined Gaia-Enceladus substructure (purple solid line).
Current usage metrics show cumulative count of Article Views (full-text article views including HTML views, PDF and ePub downloads, according to the available data) and Abstracts Views on Vision4Press platform.
Data correspond to usage on the plateform after 2015. The current usage metrics is available 48-96 hours after online publication and is updated daily on week days.
Initial download of the metrics may take a while.