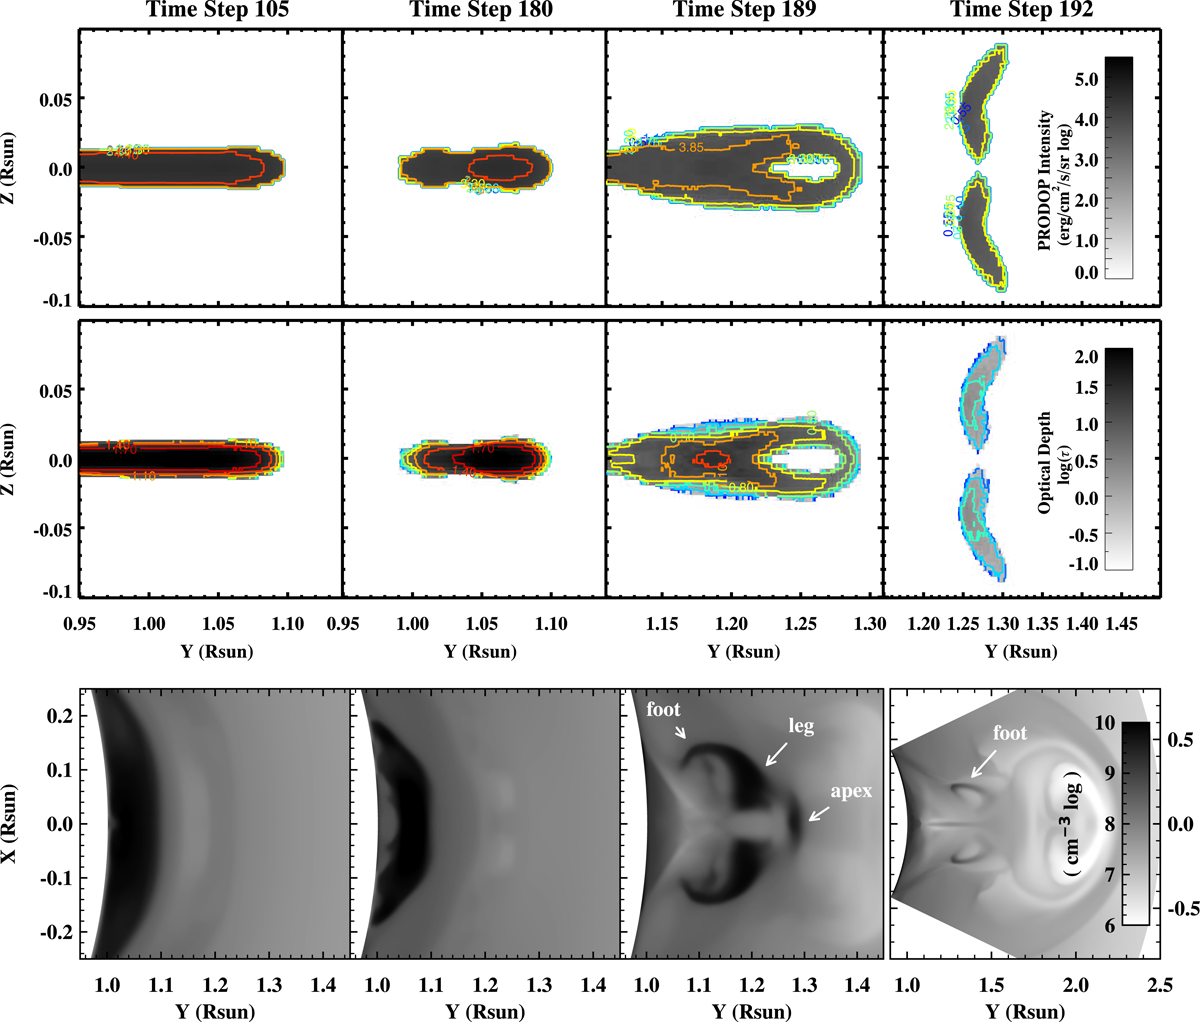
Fig. 6.
Download original image
Radiative transfer calculation for the prominence plasma and corresponding optical depth. The synthesized intensity is shown in the top panels and the optical depth is shown in the middle. The contours are overlaid to emphasize the distribution. Density distributions at the equatorial plane at four time steps are shown in the bottom panels for reference here and for Fig. 7. The apex, leg, and foot of the prominence plasma are annotated in the right two panels.
Current usage metrics show cumulative count of Article Views (full-text article views including HTML views, PDF and ePub downloads, according to the available data) and Abstracts Views on Vision4Press platform.
Data correspond to usage on the plateform after 2015. The current usage metrics is available 48-96 hours after online publication and is updated daily on week days.
Initial download of the metrics may take a while.