Fig. 5.
Download original image
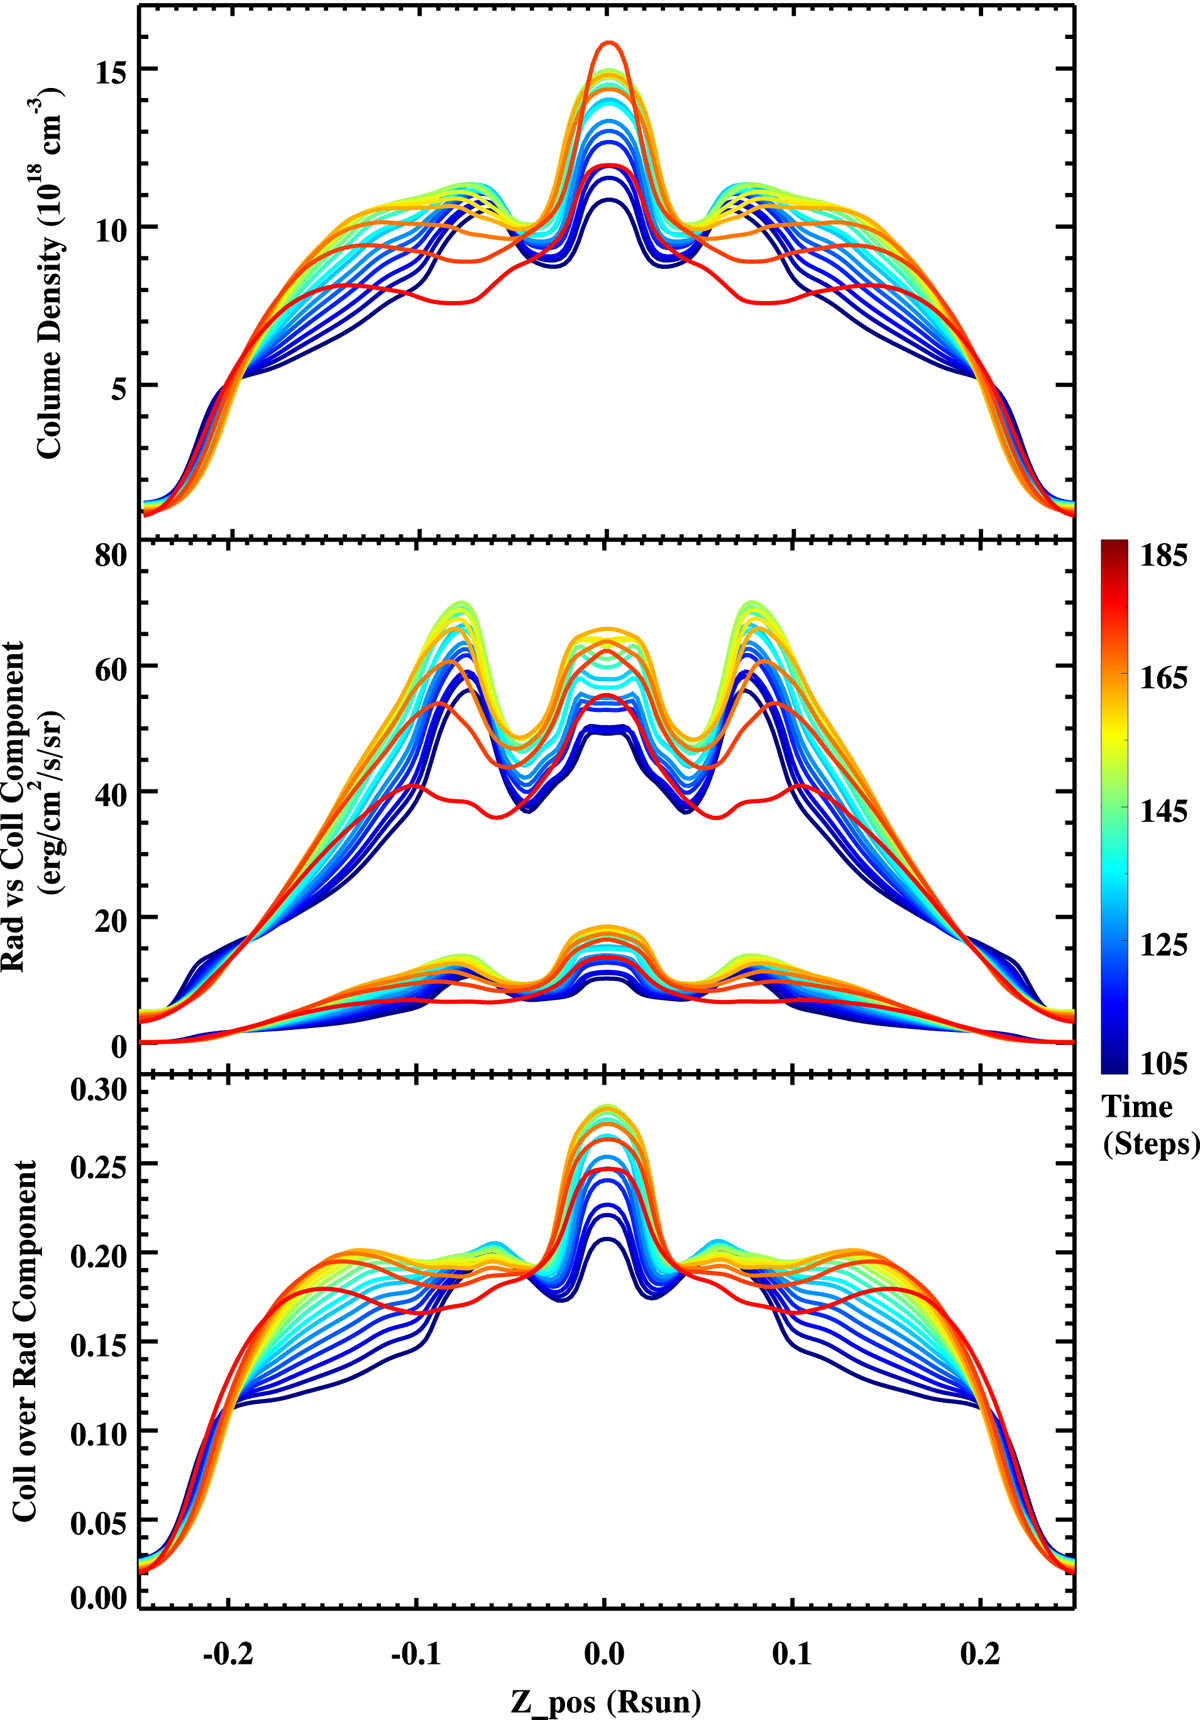
Profiles of the LOS integrated density (top); radiative and collisional components of the emission (middle); and the emission ratio (bottom), along the vertical line that goes through the central cavity (white dashed line in the right column of Fig. 4). The different colored curves correspond to the profiles at different times.
Current usage metrics show cumulative count of Article Views (full-text article views including HTML views, PDF and ePub downloads, according to the available data) and Abstracts Views on Vision4Press platform.
Data correspond to usage on the plateform after 2015. The current usage metrics is available 48-96 hours after online publication and is updated daily on week days.
Initial download of the metrics may take a while.