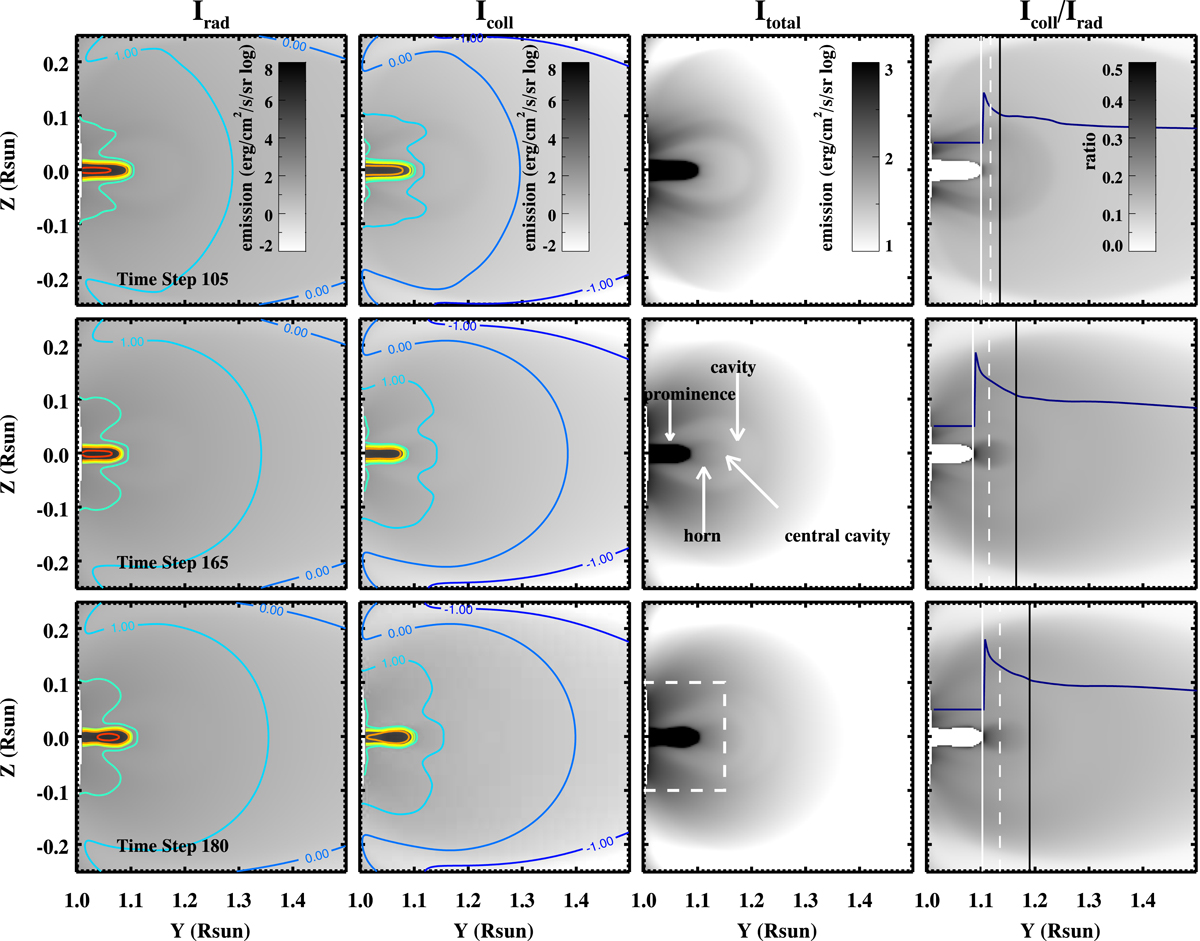
Fig. 4.
Download original image
LOS-integrated results of Fig. 2 are displayed from top to bottom: Irad, Icoll, Itotal and the ratio of Icoll and Irad are shown from left to right. The observable structures of prominence, cavity, central cavity and horn are marked in the panel of total emission at time step 165. The white dashed box gives the region where the PRODOP calculation is done for the static stage. The contours, the line curves and the vertical lines are indicated as in Fig. 2.
Current usage metrics show cumulative count of Article Views (full-text article views including HTML views, PDF and ePub downloads, according to the available data) and Abstracts Views on Vision4Press platform.
Data correspond to usage on the plateform after 2015. The current usage metrics is available 48-96 hours after online publication and is updated daily on week days.
Initial download of the metrics may take a while.