Fig. 3.
Download original image
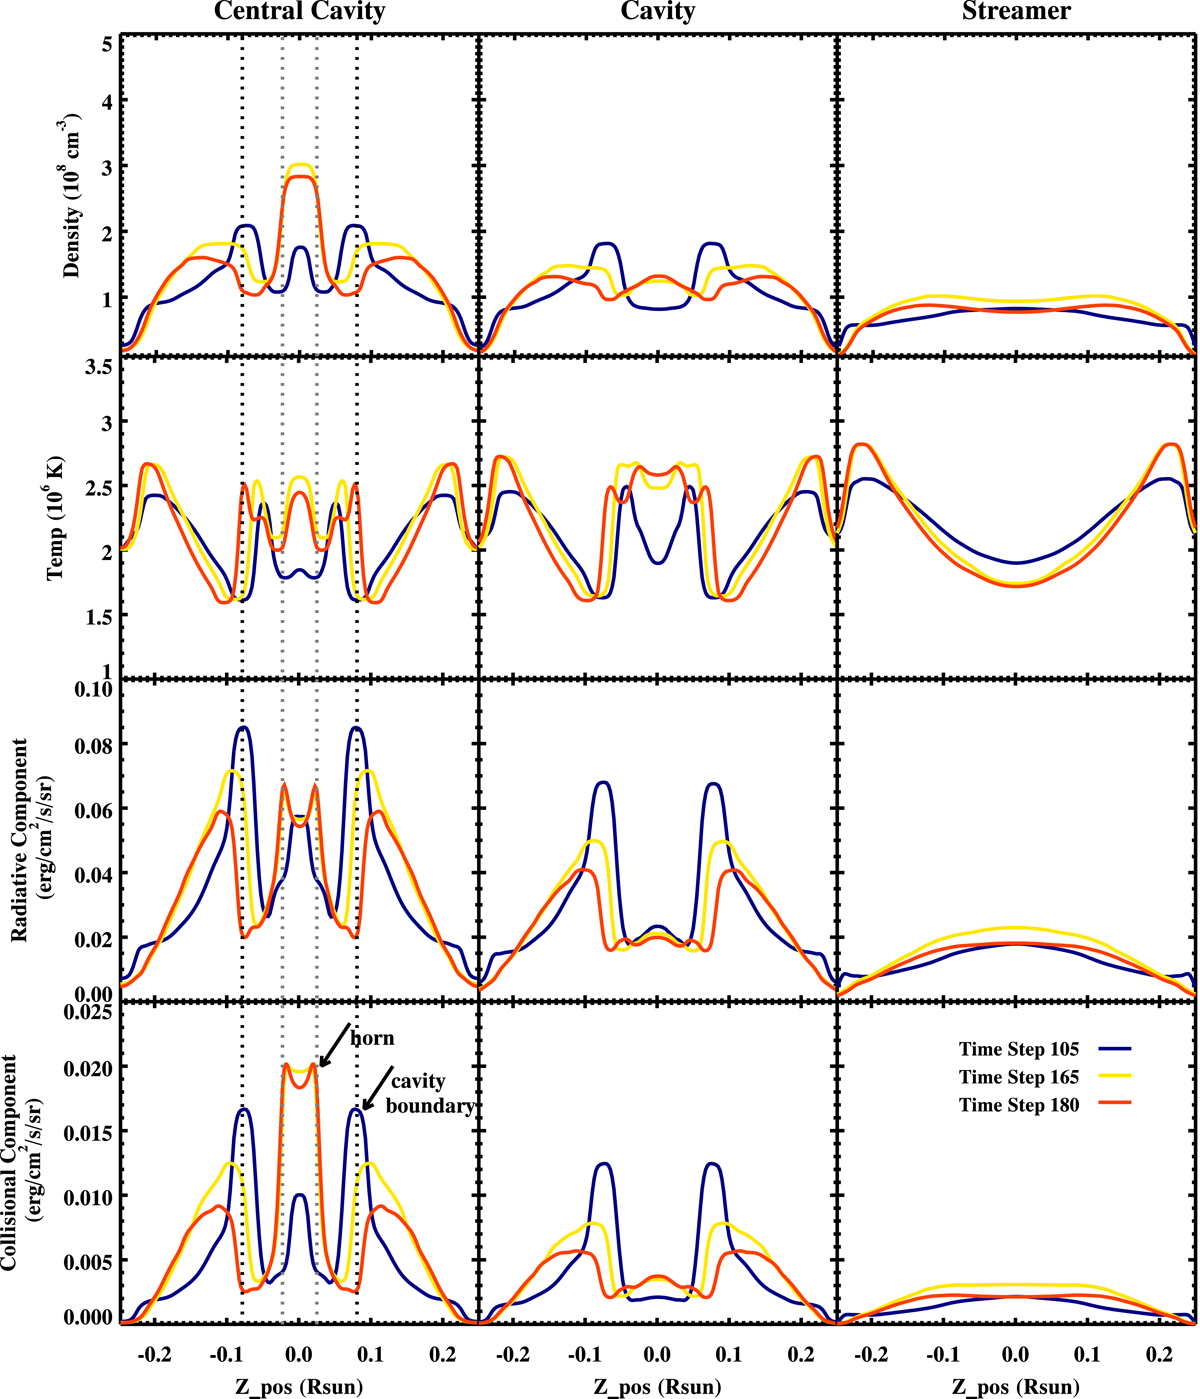
Comparison of physical parameters and synthesized emissions at different locations of the central cavity, cavity, and streamer background as described in the caption to Fig. 2. Results sampled at different locations as mentioned above are displayed from left to right. The distributions of density, temperature, radiative component, and collisional component emission are shown from top to bottom. Results at three different times are shown with different colors in each panels.
Current usage metrics show cumulative count of Article Views (full-text article views including HTML views, PDF and ePub downloads, according to the available data) and Abstracts Views on Vision4Press platform.
Data correspond to usage on the plateform after 2015. The current usage metrics is available 48-96 hours after online publication and is updated daily on week days.
Initial download of the metrics may take a while.