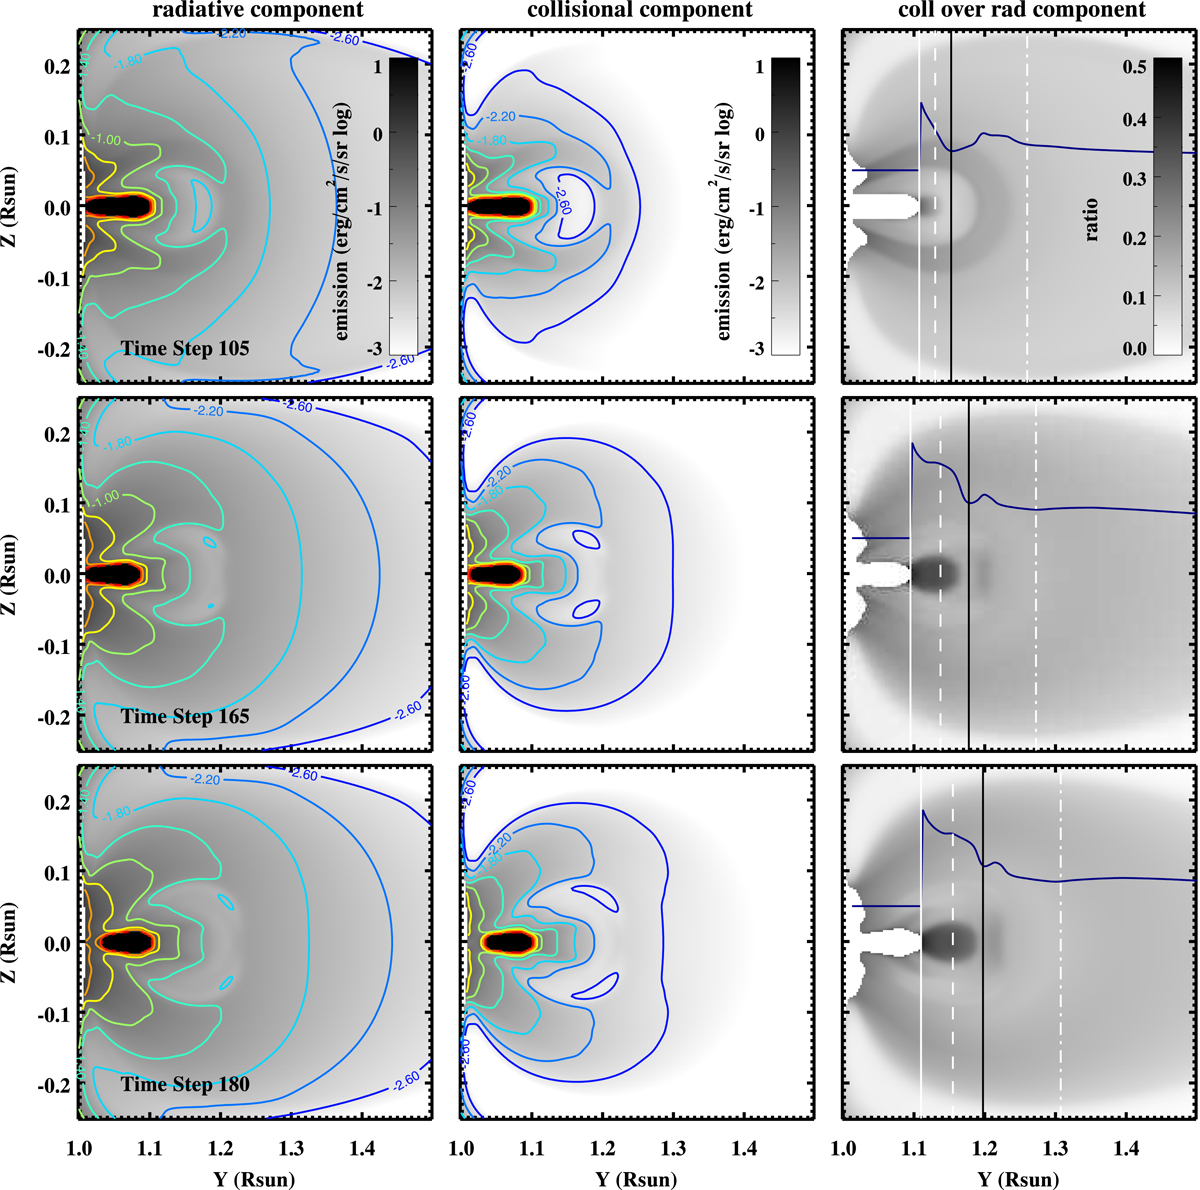
Fig. 2.
Download original image
Synthesized results of Lyman-α emission shown for a slice centered on the plane-of-sky at three different times of the static stage (time steps 105, 165, and 180) are displayed in the top, middle, and bottom rows, respectively. The radiative component, the collisional component, and ratio of the two components are shown in the left, middle, and right columns, respectively. In the first two columns, contours are overlaid on the intensity maps to emphasize the structures. The horizontal curve embedded in each of the right column panels shows the profile of the ratio along the Z = 0 line above the limb. The vertical solid lines in black and white indicate the bottom and top of the central cavity, while the dashed line passes through the cavity. The dashed-dotted line marks a location above the cavity and in the streamer. Profiles of the physical quantities and emissions along these vertical lines (except white solid line) are shown in Fig. 3.
Current usage metrics show cumulative count of Article Views (full-text article views including HTML views, PDF and ePub downloads, according to the available data) and Abstracts Views on Vision4Press platform.
Data correspond to usage on the plateform after 2015. The current usage metrics is available 48-96 hours after online publication and is updated daily on week days.
Initial download of the metrics may take a while.