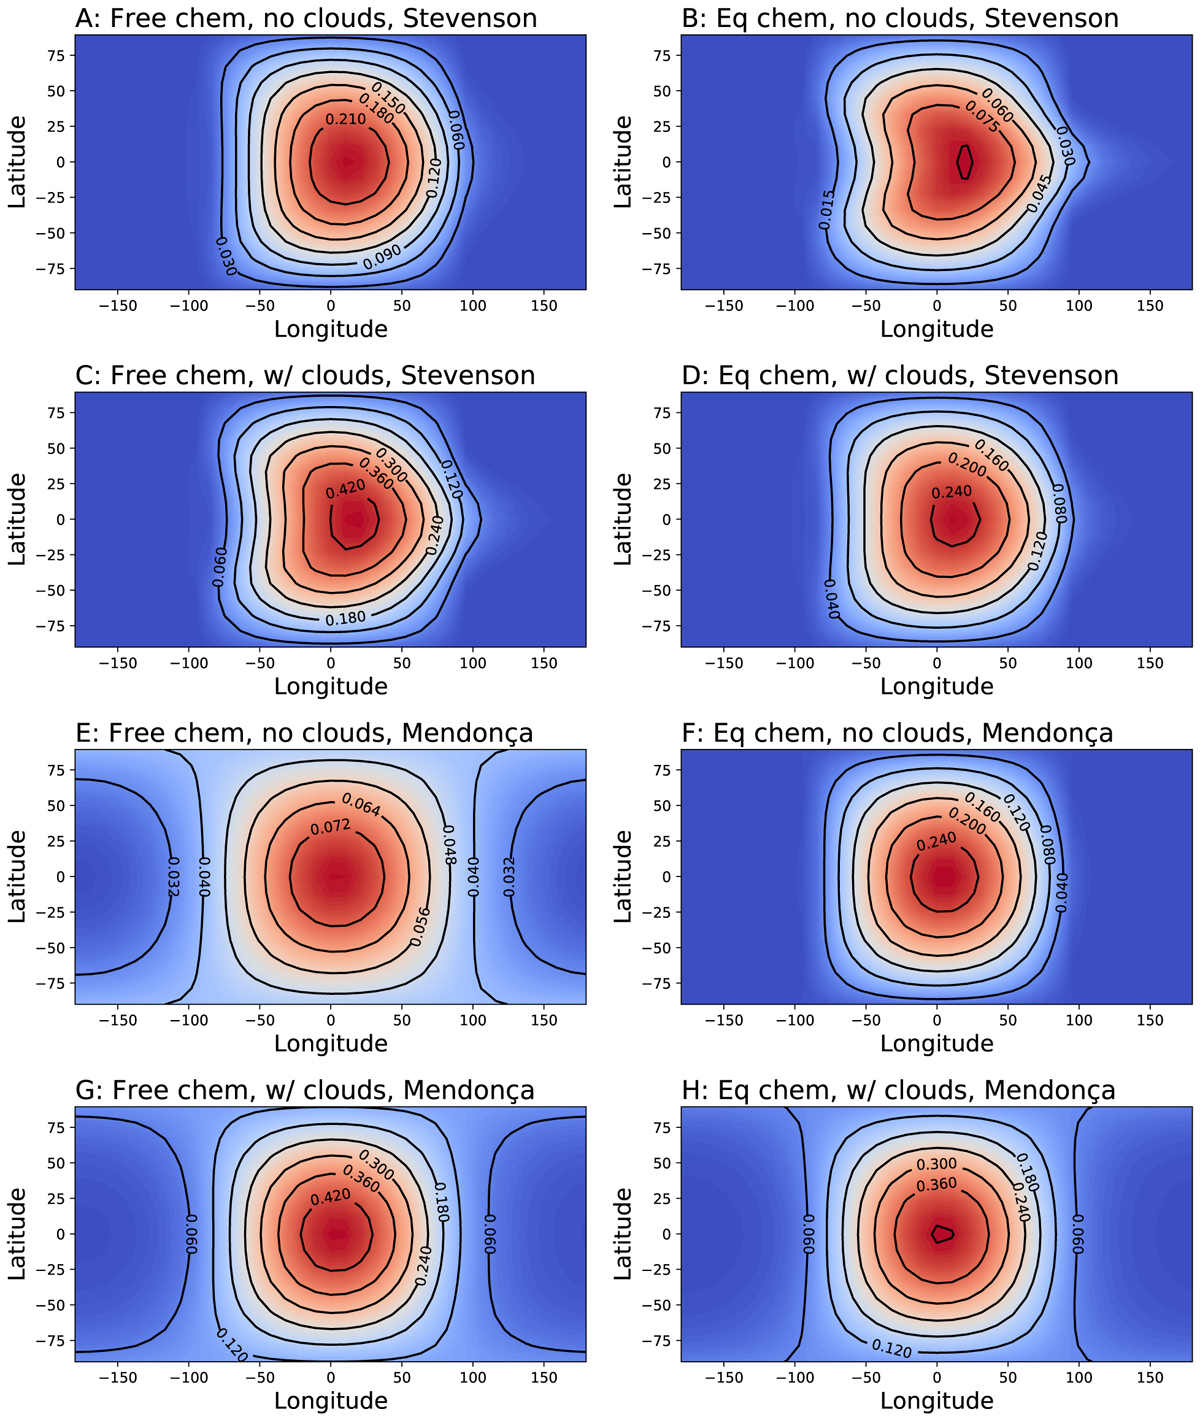
Fig. A.4
Download original image
Contour plots giving retrieved β (where β specifies how the energy incident from the central star is spread through the atmosphere; see Eq. 3) as a function of longitude and latitude for the eight different retrieval setups, as detailed above each panel, β can be used in Eq 7 to compute the temperature at a given pressure layer as a function of longitude and latitude; see Figures A.5 and A.6. Stevenson and Mendonça refer to the use of Spitzer data analysed by Stevenson et al. (2017) and Mendonça et al. (2018a), respectively.
Current usage metrics show cumulative count of Article Views (full-text article views including HTML views, PDF and ePub downloads, according to the available data) and Abstracts Views on Vision4Press platform.
Data correspond to usage on the plateform after 2015. The current usage metrics is available 48-96 hours after online publication and is updated daily on week days.
Initial download of the metrics may take a while.