Fig. A.3
Download original image
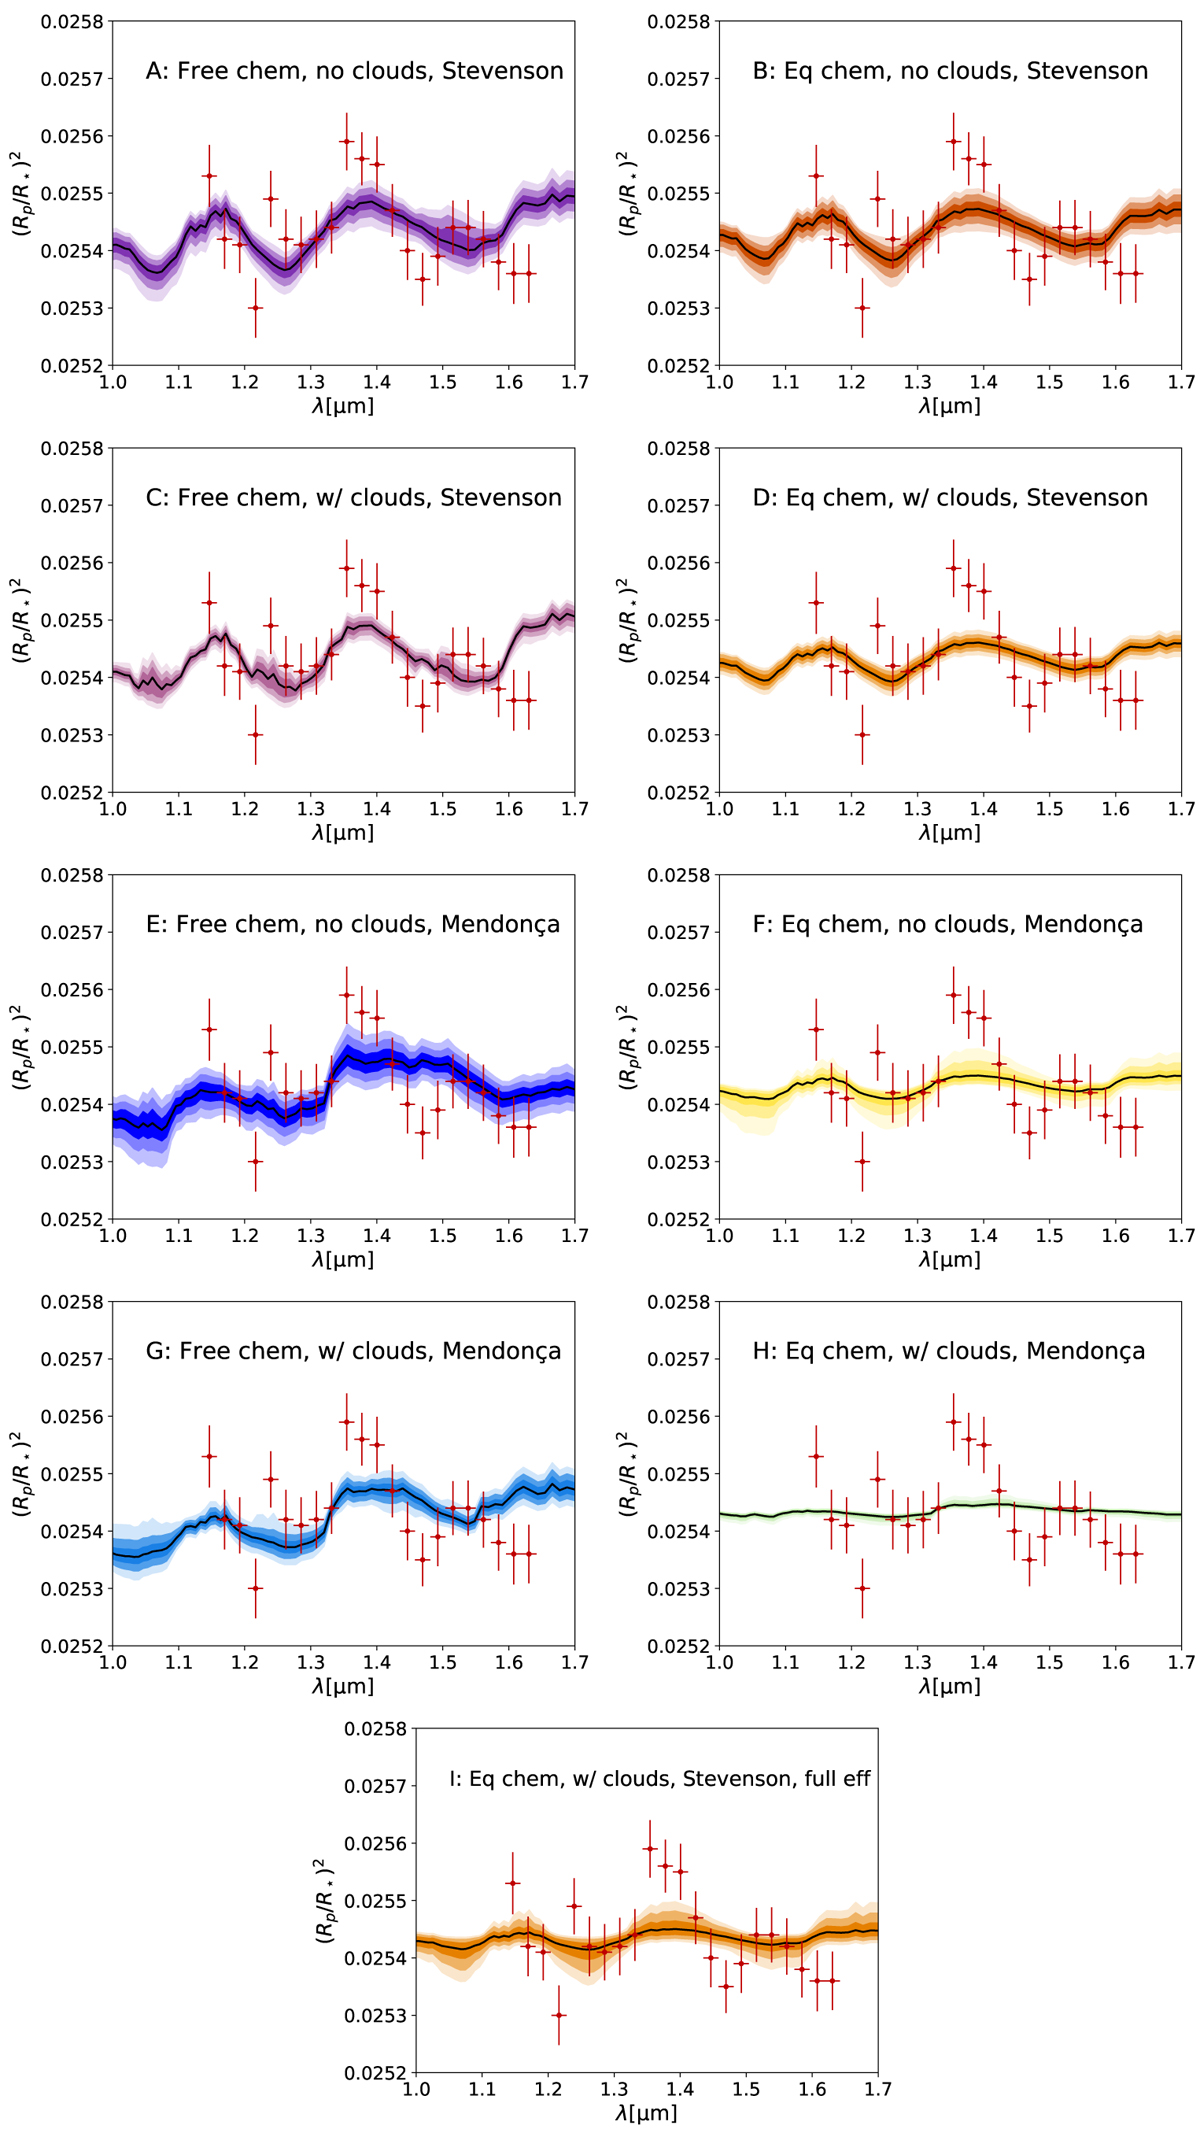
Retrieved and observed HST/WFC3 transmission spectra for our eight different retrieval setups (plus additional setup I), as detailed in each panel. The shading represents the 1, 2, and 3 σ bounds. Observed data (HST/WFC3) points are plotted with error bars. Stevenson and Mendonça refer to the use of Spitzer data analysed by Stevenson et al. (2017) and Mendonça et al. (2018a), respectively.
Current usage metrics show cumulative count of Article Views (full-text article views including HTML views, PDF and ePub downloads, according to the available data) and Abstracts Views on Vision4Press platform.
Data correspond to usage on the plateform after 2015. The current usage metrics is available 48-96 hours after online publication and is updated daily on week days.
Initial download of the metrics may take a while.