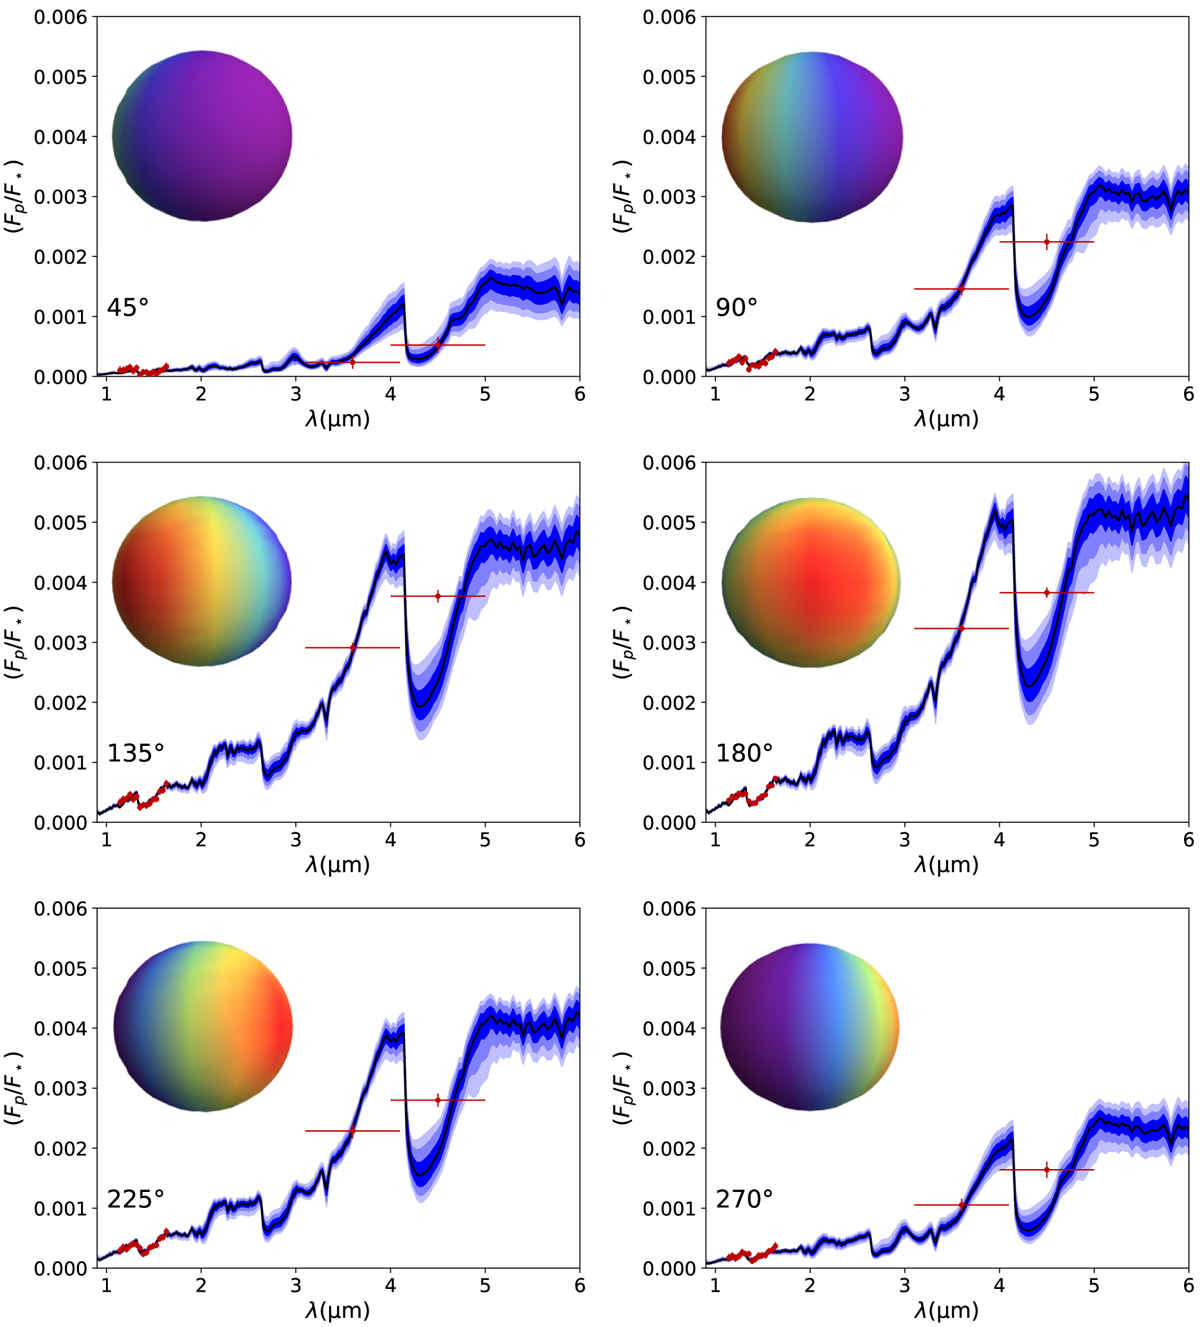
Fig. 2
Download original image
Emission spectra retrieved at different phases plotted with the observed data for each phase (as given in the bottom left of each panel) for retrieval setup A (no clouds, free chemistry, and Stevenson et al. 2017 Spitzer analysis). The left of each panel shows the heat distribution over the surface of the planet, as computed by ARCiS during the retrieval.
Current usage metrics show cumulative count of Article Views (full-text article views including HTML views, PDF and ePub downloads, according to the available data) and Abstracts Views on Vision4Press platform.
Data correspond to usage on the plateform after 2015. The current usage metrics is available 48-96 hours after online publication and is updated daily on week days.
Initial download of the metrics may take a while.