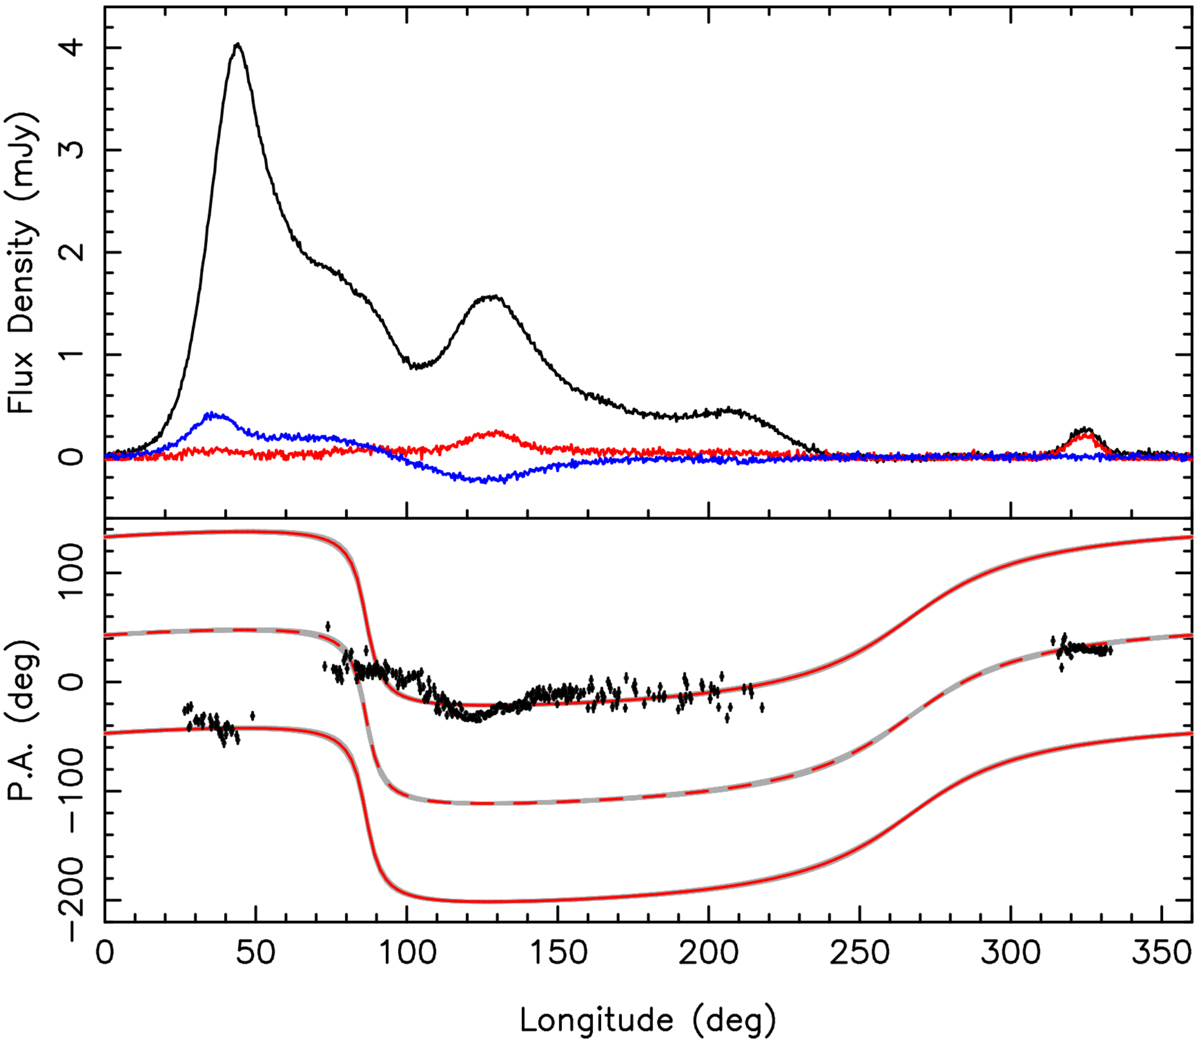
Fig. 3.
Download original image
Polarisation profile as observed with MeerKAT at a central frequency of 1284 MHz, integrating a total of 32.6 h. Top panel: total intensity (black), the linear intensity (red), and the circular polarisation intensity (blue). Bottom panel: values of the position angle (PA) swing. A RVM has been fitted to the PA values, and is shown as a red solid line and repeated offset by 180 deg, while the dashed line indicates the RVM solution separated by 90 deg and intended to fit the interpulse. The grey band indicates the derived uncertainties in the determined RVM description. See Sect. 6 for details.
Current usage metrics show cumulative count of Article Views (full-text article views including HTML views, PDF and ePub downloads, according to the available data) and Abstracts Views on Vision4Press platform.
Data correspond to usage on the plateform after 2015. The current usage metrics is available 48-96 hours after online publication and is updated daily on week days.
Initial download of the metrics may take a while.