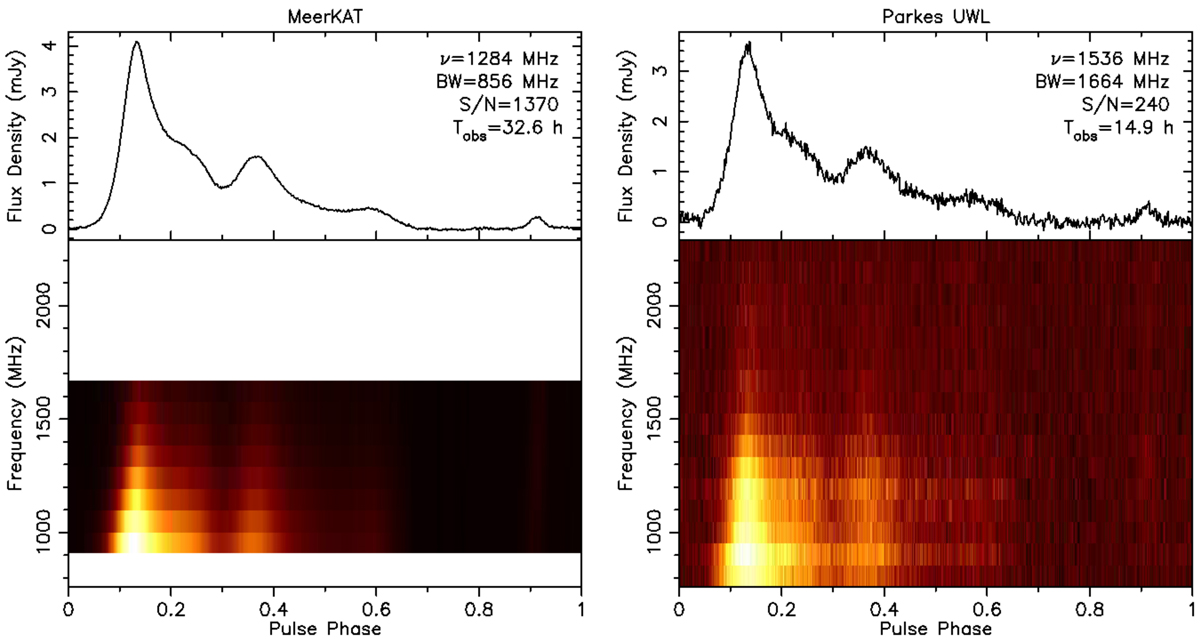
Fig. 1.
Download original image
Flux calibrated total intensity profiles made from observations made with MeerKAT (left plot) and Parkes (right plot) radio telescopes. The MeerKAT profile was made from a total of ∼32.6 h of observations with L-band receiver centred at 1284 MHz with a bandwidth of 856 MHz. The Parkes profile was made from a total of ∼14.9 h of observations with the two lower sub-bands of the UWL receiver with a centre frequency of 1536 MHz and a bandwidth of 1664 MHz. The profiles were bin-scrunched down to 512 bins across the pulse phase in order to increase the signal-to-noise ratio (S/N) per phase bin. The bottom panels show the dynamic spectra, made from 8 and 16 contiguous frequency bands for MeerKAT and Parkes, respectively. The number of bands was chosen to result in the same frequency width per band for both telescopes and correspond to the flux measurements shown in Fig. 2. The frequency range of the dynamic spectrum from MeerKAT was aligned to that of Parkes for ease of comparison. The frequency evolution of the pulse profile and the steep spectral index are clearly visible.
Current usage metrics show cumulative count of Article Views (full-text article views including HTML views, PDF and ePub downloads, according to the available data) and Abstracts Views on Vision4Press platform.
Data correspond to usage on the plateform after 2015. The current usage metrics is available 48-96 hours after online publication and is updated daily on week days.
Initial download of the metrics may take a while.