Fig. 7.
Download original image
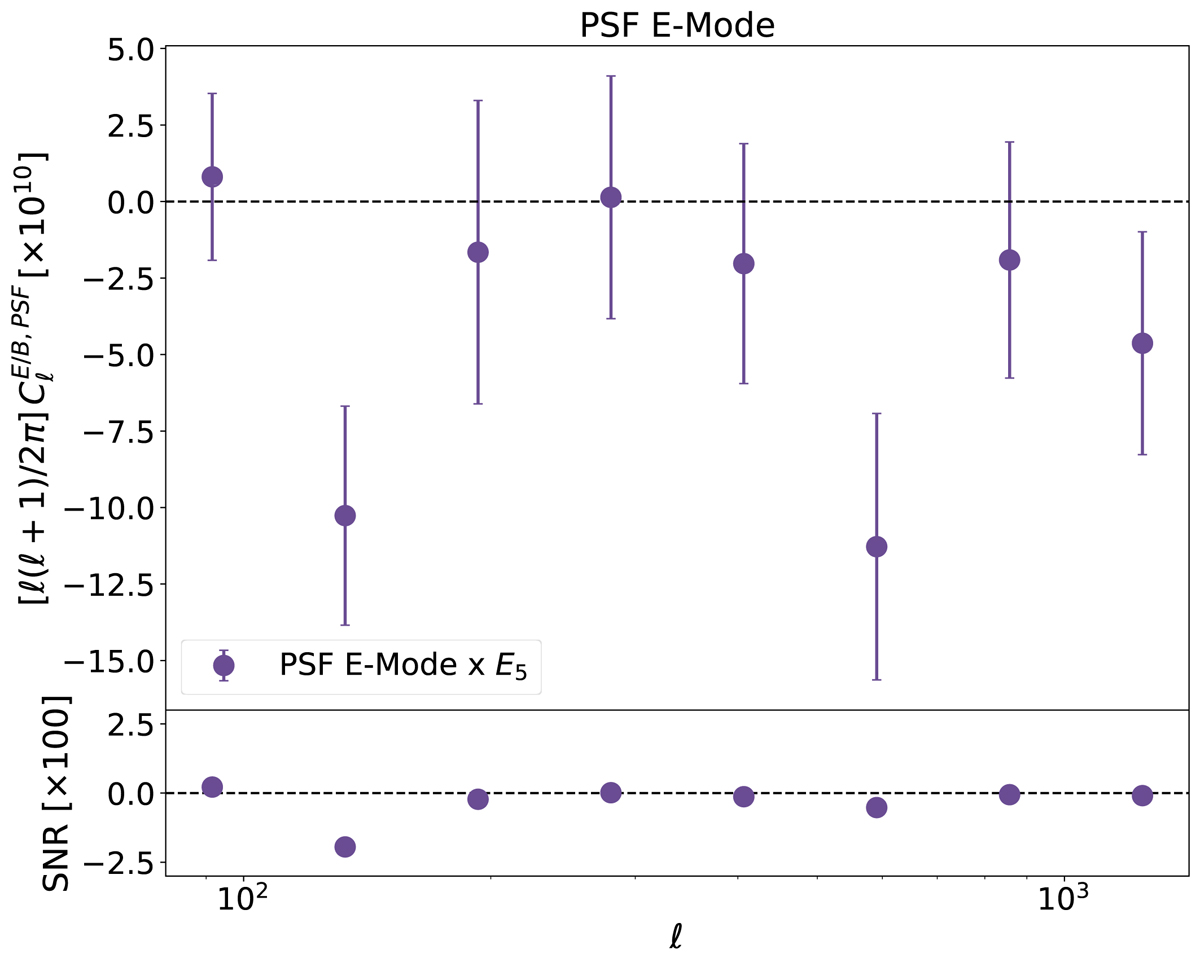
PSF E-mode and E5 cross-power spectrum. Top panel: cross-angular power spectra between PSF E-mode component and E5 with the α-correction from Giblin et al. (2021) applied to the PSF ellipticities. Bottom panel: signal-to-noise ratio as defined by Eq. (B.1), showing that the largest S/N multipole bandwidth has S/N ∼ −2.5 × 10⁻², meaning that it is well within the estimated covariance for our analysis.
Current usage metrics show cumulative count of Article Views (full-text article views including HTML views, PDF and ePub downloads, according to the available data) and Abstracts Views on Vision4Press platform.
Data correspond to usage on the plateform after 2015. The current usage metrics is available 48-96 hours after online publication and is updated daily on week days.
Initial download of the metrics may take a while.