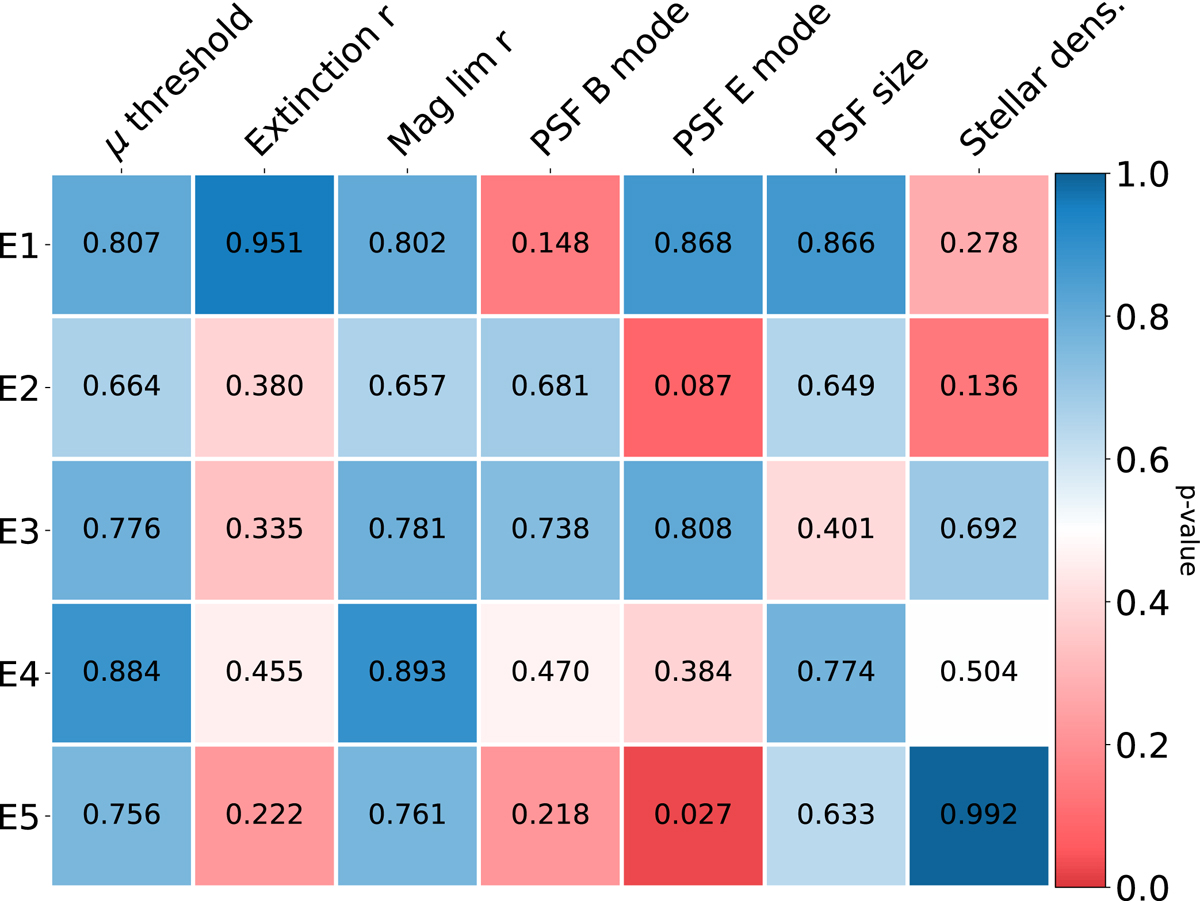
Fig. 6.
Download original image
P-values for the cross-correlations between the data’s tomographic pseudo E-modes and different systematics for a null detection (p ≤ 0.05 would indicate a detection). Here we show the systematics motivated in Sect. 4: object detection threshold (μ-threshold), extinction for the r-band, magnitude limit for the r-band, PSF ellipticities components in harmonic space (E/B-mode), the PSF size, and stellar overdensity from Gaia DR2 (Gaia Collaboration 2018). The highest correlation occurs for the PSF E-mode in the fifth tomographic bin, this is shown in Fig. 7 to be subdominant to the cosmological signal given the estimated statistical error in this particular tomographic bin.
Current usage metrics show cumulative count of Article Views (full-text article views including HTML views, PDF and ePub downloads, according to the available data) and Abstracts Views on Vision4Press platform.
Data correspond to usage on the plateform after 2015. The current usage metrics is available 48-96 hours after online publication and is updated daily on week days.
Initial download of the metrics may take a while.