Open Access
Fig. 5.
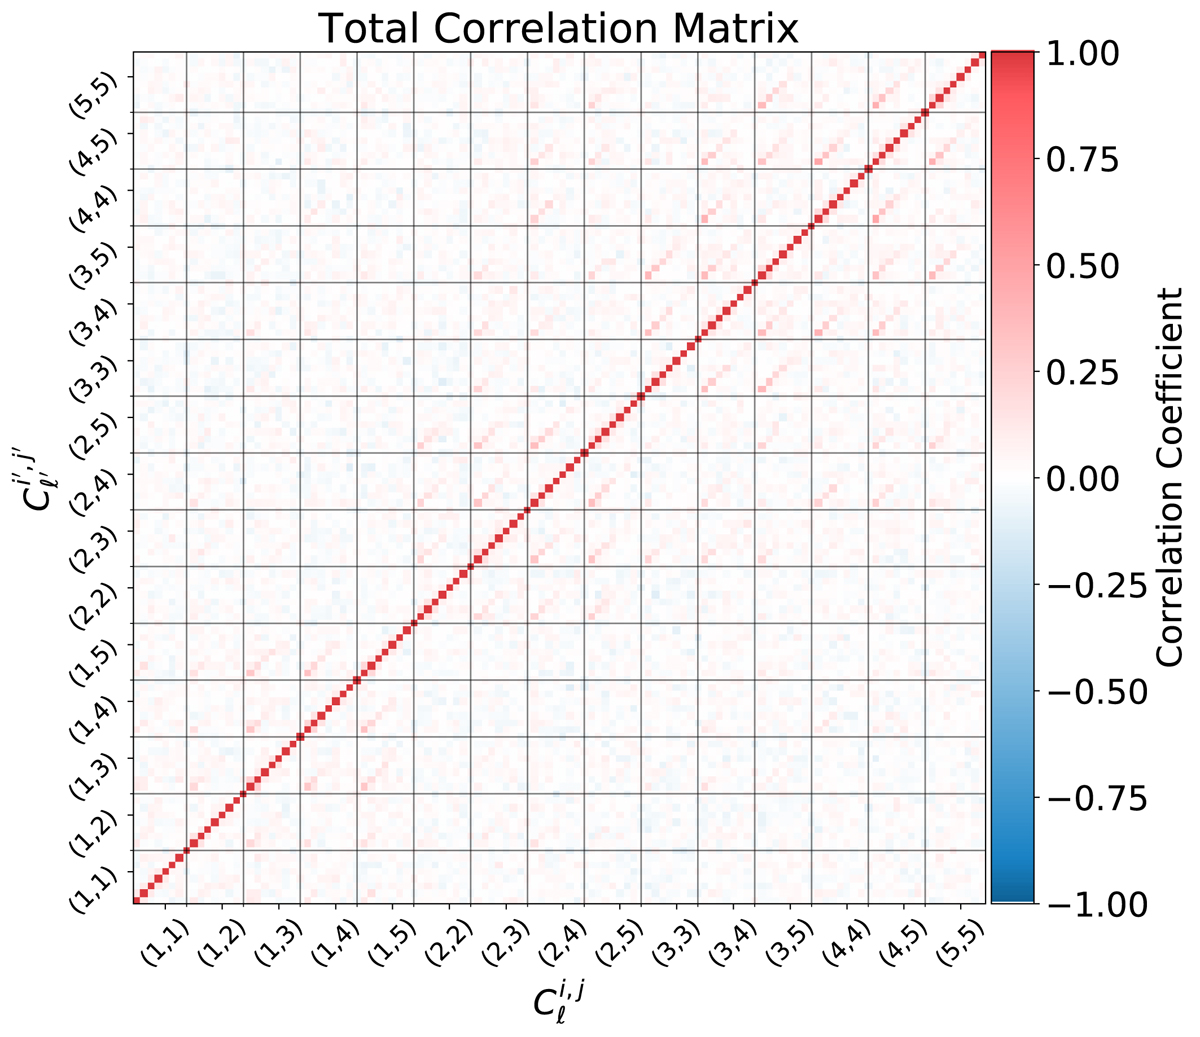
Download original image
Correlation matrix for the E-mode pseudo-Cℓ covariance. The covariance matrix was calculated using 1000 mocks from the Egretta suite of Flask + Salmo simulations (Joachimi et al. 2021b). The indices (i, j) in the labels are the redshift bin numbers for each pair of ![]() E-modes.
E-modes.
Current usage metrics show cumulative count of Article Views (full-text article views including HTML views, PDF and ePub downloads, according to the available data) and Abstracts Views on Vision4Press platform.
Data correspond to usage on the plateform after 2015. The current usage metrics is available 48-96 hours after online publication and is updated daily on week days.
Initial download of the metrics may take a while.