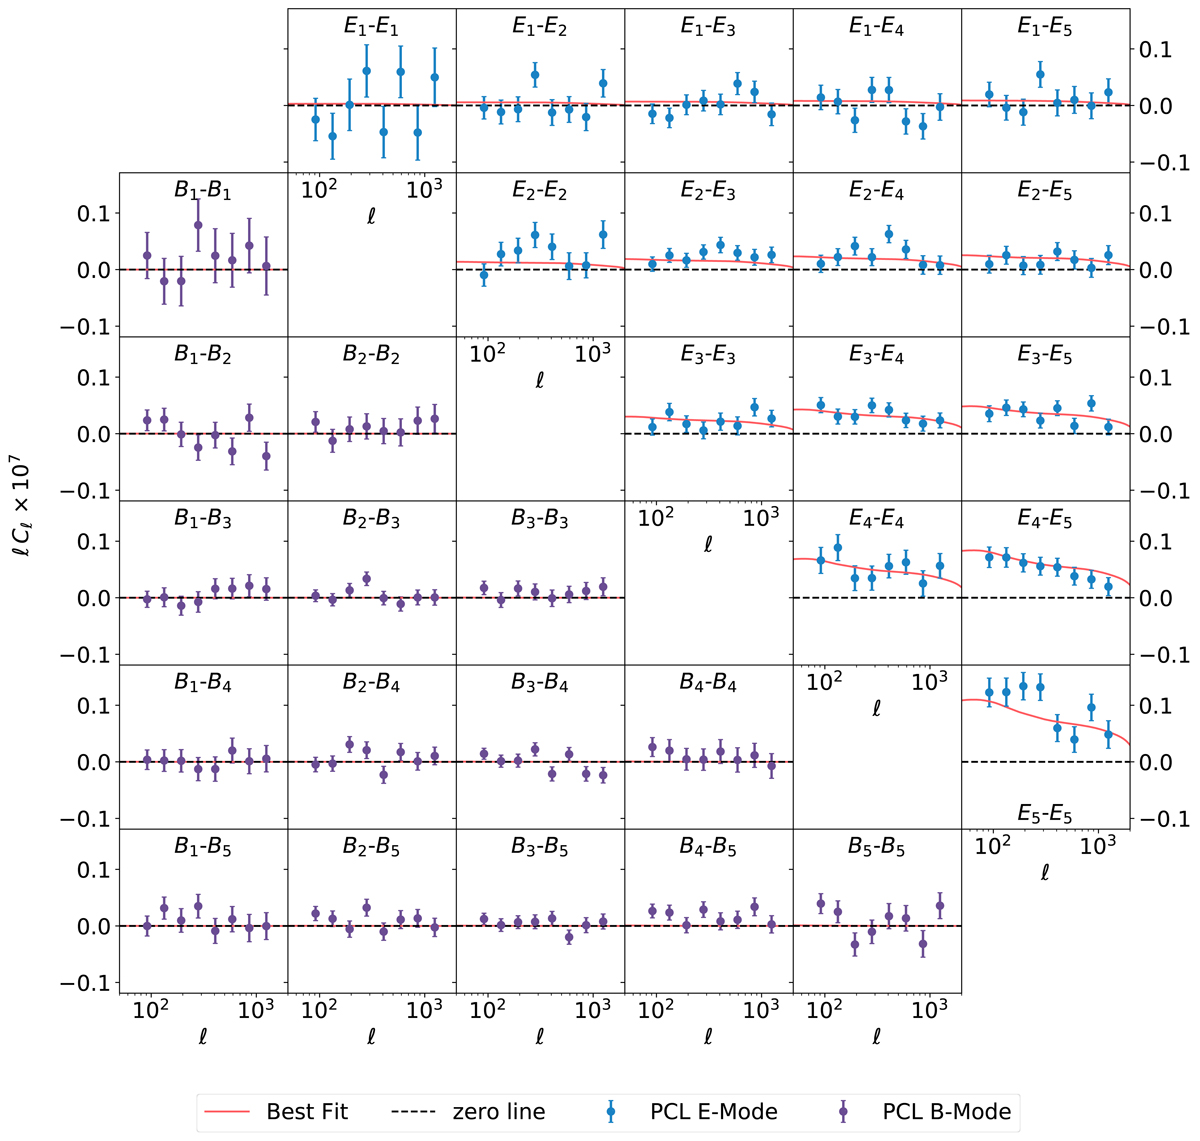
Fig. 4.
Download original image
KiDS-1000 E-mode (upper triangle) and B-mode (lower triangle) pseudo-Cℓ measurements with the best-fit model from our cosmological analysis in Sect. 6.1 convolved with the data’s mixing matrix (Eq. (14)). The auto- and cross-angular power spectra have been measured in eight log-spaced bandwidths from 76 ≤ ℓ ≤ 1500. The error bars are estimated from the covariance (described in Sect. 3.4), calculated with Flask (Xavier et al. 2016) and Salmo (Joachimi et al. 2021b) simulations. We include the best-fit theory for the pseudo B-modes using Eq. (15) (red line); the amplitude is too small to be distinguishable from the zero line with a reduced χ2 ∼ 1 for a null detection.
Current usage metrics show cumulative count of Article Views (full-text article views including HTML views, PDF and ePub downloads, according to the available data) and Abstracts Views on Vision4Press platform.
Data correspond to usage on the plateform after 2015. The current usage metrics is available 48-96 hours after online publication and is updated daily on week days.
Initial download of the metrics may take a while.