Fig. 3.
Download original image
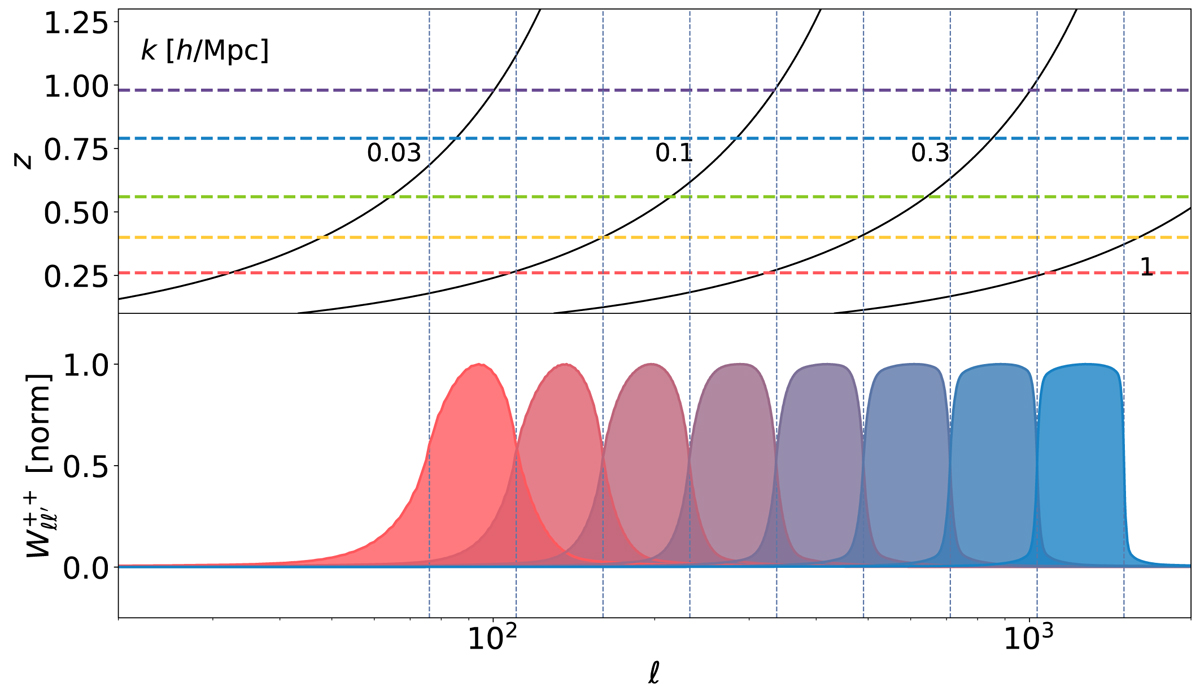
Binned mixing matrices as band-pass filters and the physical scales mixed for each redshift tomographic bin edge. Top: redshift as a function of multipole for different wave-numbers. The coloured horizontal dashed-lines are the centre of the redshift tomographic bins used in the analysis and shown in Fig. 1; the black lines are curves of constant wavenumber, k = ℓ/χ(z), in units of h Mpc−1 for a given ℓ and z, where χ(z) is the co-moving distance. Bottom: the KiDS-1000 pseudo-Cℓs binned mixing matrices (see Fig. 2, for example). These are convolved with the theory Cℓs (see Eq. (23)) to model the effect of multipole mixing introduced by the survey mask. The filters are calculated using all the multipoles inside the eight log-spaced bandwidths from 76 ≤ ℓ ≤ 1500.
Current usage metrics show cumulative count of Article Views (full-text article views including HTML views, PDF and ePub downloads, according to the available data) and Abstracts Views on Vision4Press platform.
Data correspond to usage on the plateform after 2015. The current usage metrics is available 48-96 hours after online publication and is updated daily on week days.
Initial download of the metrics may take a while.