Free Access
Fig. 8.
Download original image
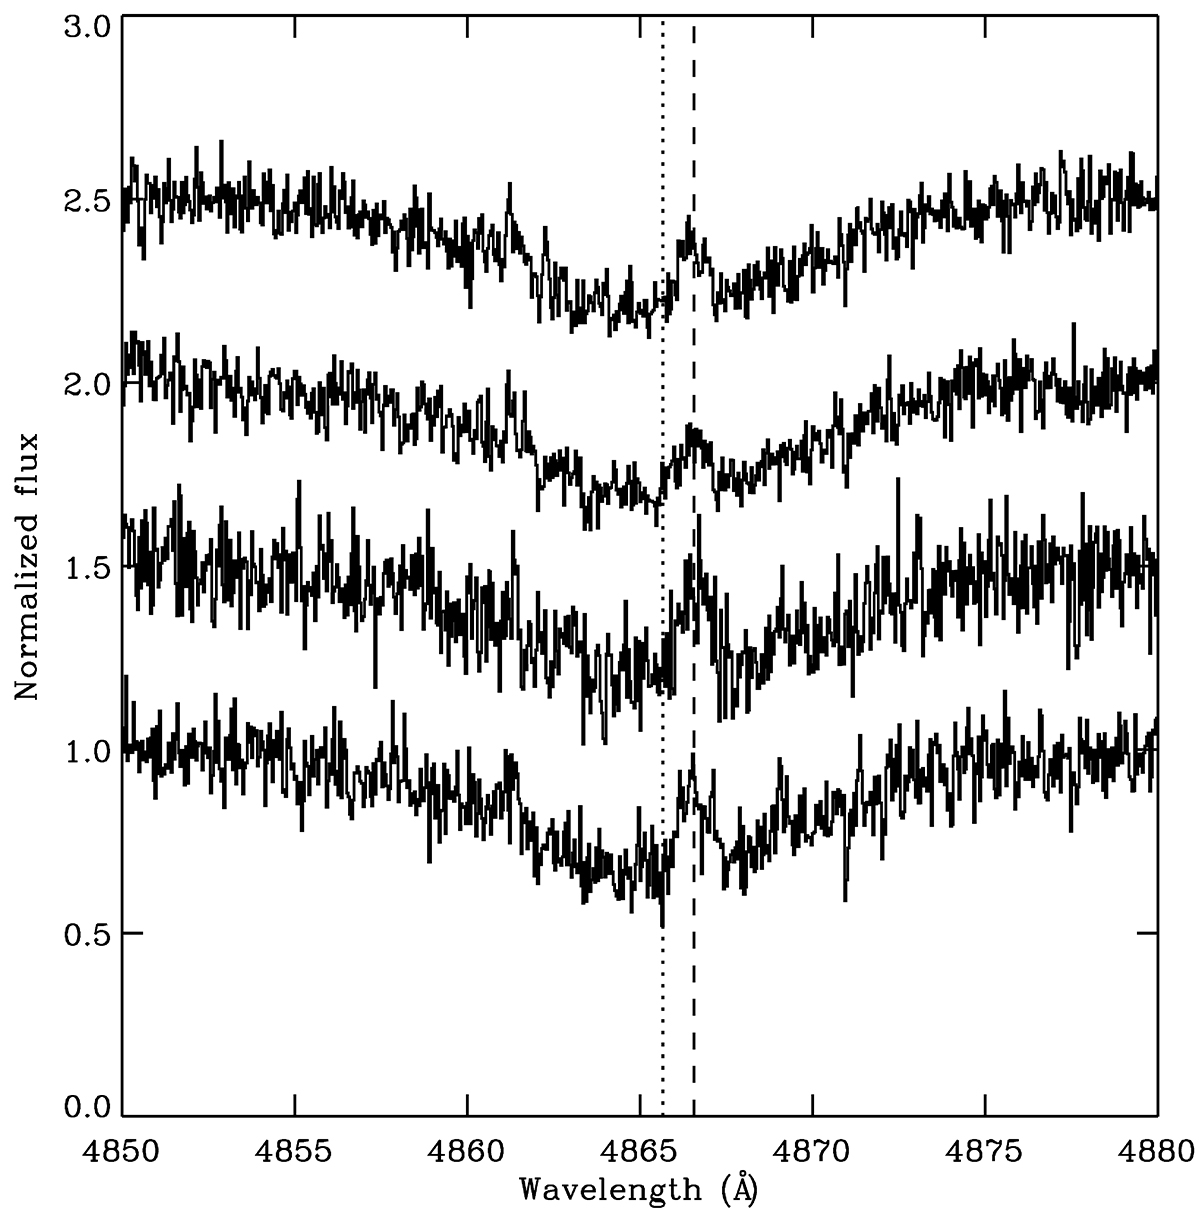
Residual (i.e., primary subtracted) Hβ profiles from the SALT/HRS data, observations 1 through 4 are from bottom to top, shifted by 0.5 units for clarity. The vertical lines indicate the mean positions of the absorption components (dotted line) and emission components (dashed line), from Tables 4 and 5.
Current usage metrics show cumulative count of Article Views (full-text article views including HTML views, PDF and ePub downloads, according to the available data) and Abstracts Views on Vision4Press platform.
Data correspond to usage on the plateform after 2015. The current usage metrics is available 48-96 hours after online publication and is updated daily on week days.
Initial download of the metrics may take a while.