Fig. 4.
Download original image
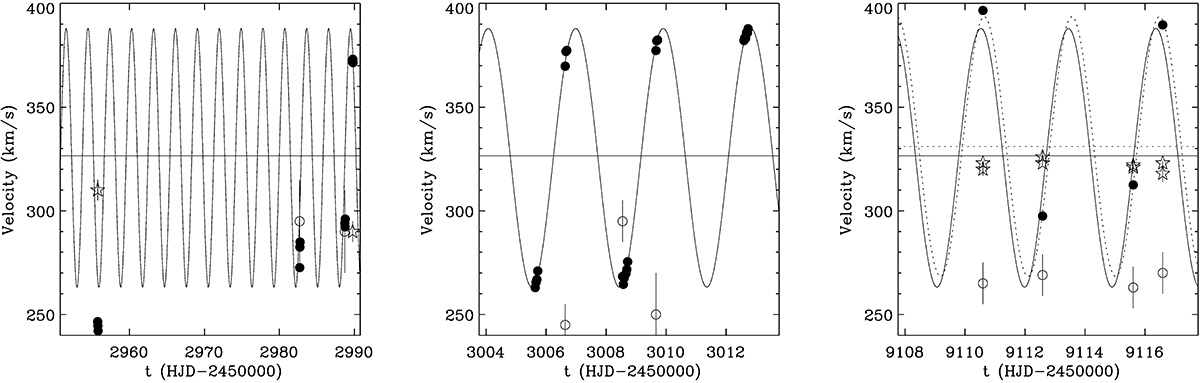
Central panel: comparison of the solution derived from the late epoch FSMS data only (solid line) with the observed radial velocities of the primary, filled circles plus (small) error bars. Left panel: comparison of that solution with the early epoch FSMS data. Right panel; comparison with the SALT/HRS data. Horizontal lines indicate the systemic velocity of this solution. The dotted lines in the right panel are the solutions obtained by fitting those radial velocities but fixing both the period, eccentricity and semi-amplitude velocity to the values derived from the late FSMS data. Open star symbols are the velocities of the emission features (Table 5), and open circles are velocities of the broad-lined component (Table 4) that we identify as a possible tertiary.
Current usage metrics show cumulative count of Article Views (full-text article views including HTML views, PDF and ePub downloads, according to the available data) and Abstracts Views on Vision4Press platform.
Data correspond to usage on the plateform after 2015. The current usage metrics is available 48-96 hours after online publication and is updated daily on week days.
Initial download of the metrics may take a while.