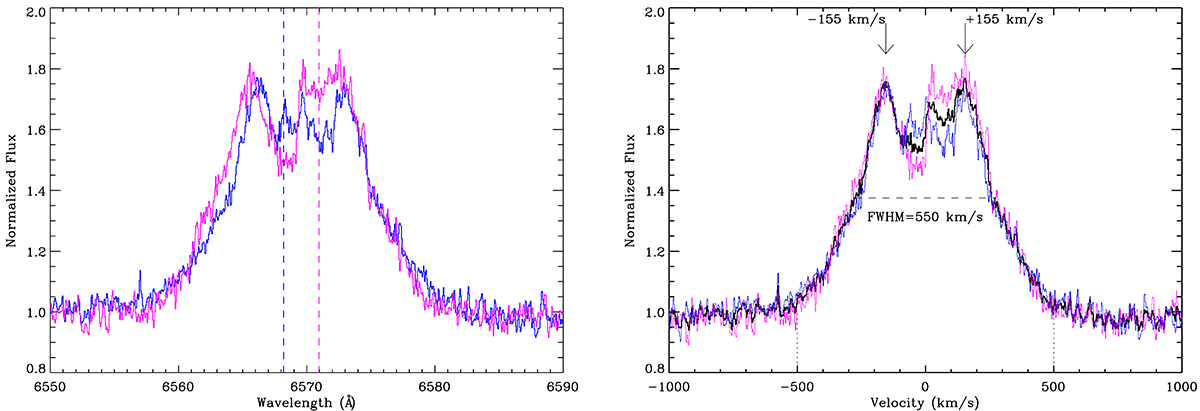
Fig. 10.
Download original image
Left panel: VLT-FLAMES OB1 (blue) and OB2 (magenta) Hα profiles resulting from subtraction of the underlying spectrum of the narrow-lined B-type star. Horizontal lines, same color coding, represent the rest frame velocity of the primary at these epochs. Note that a small residual velocity shift is still apparent (cf Fig. 1). Right panel: the same profiles plotted in their rest frame velocities; OB1 and OB2 spectra in blue and magenta respectively, the merged spectrum is plotted in black. Also illustrated are the velocities of the double peaks (±155 km s−1), the full-width half-maximim (FWHM) of the emission (550 km s−1), and the extent to which emission is present in the line wings (±500 km s−1). These spectra were taken ∼34 days apart and some variability is apparent within the double-peaked structure of the profile.
Current usage metrics show cumulative count of Article Views (full-text article views including HTML views, PDF and ePub downloads, according to the available data) and Abstracts Views on Vision4Press platform.
Data correspond to usage on the plateform after 2015. The current usage metrics is available 48-96 hours after online publication and is updated daily on week days.
Initial download of the metrics may take a while.