Fig. 6.
Download original image
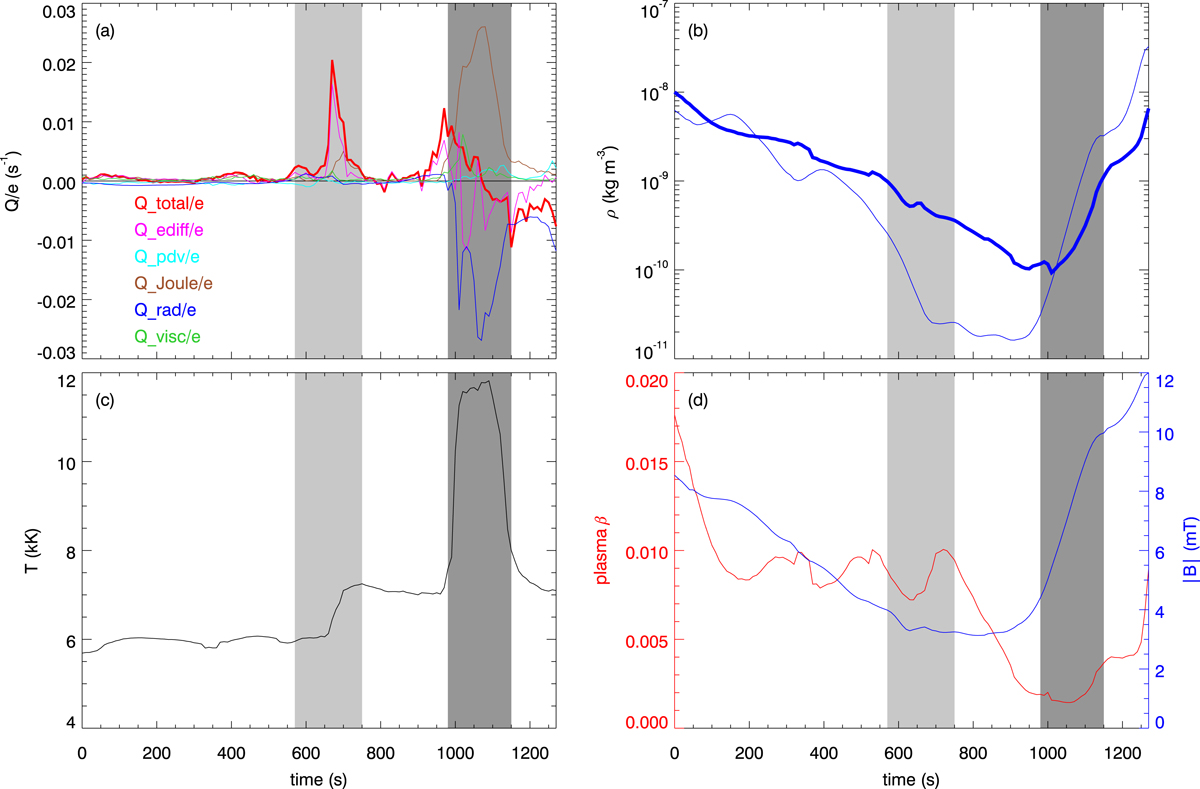
Heating and MHD quantities of the representative cork A in fibril 1 as functions of time. In each panel the cork formation period defined by the upswing of the photospheric box oscillation is shaded a lighter grey and the fibril destruction period is shown in a darker grey. Panel a: heating rate divided by internal energy density Q/e for work done by energy diffusion (magenta), compression (cyan), Joule heating (brown), radiation (blue), viscosity (green), and their sum (red). Panel b: mass density (thick blue), as well as the average mass density at the height of the cork (thin blue). Panel c: temperature. Panel d: magnetic field strength (blue) and plasma β (red).
Current usage metrics show cumulative count of Article Views (full-text article views including HTML views, PDF and ePub downloads, according to the available data) and Abstracts Views on Vision4Press platform.
Data correspond to usage on the plateform after 2015. The current usage metrics is available 48-96 hours after online publication and is updated daily on week days.
Initial download of the metrics may take a while.