Fig. 5.
Download original image
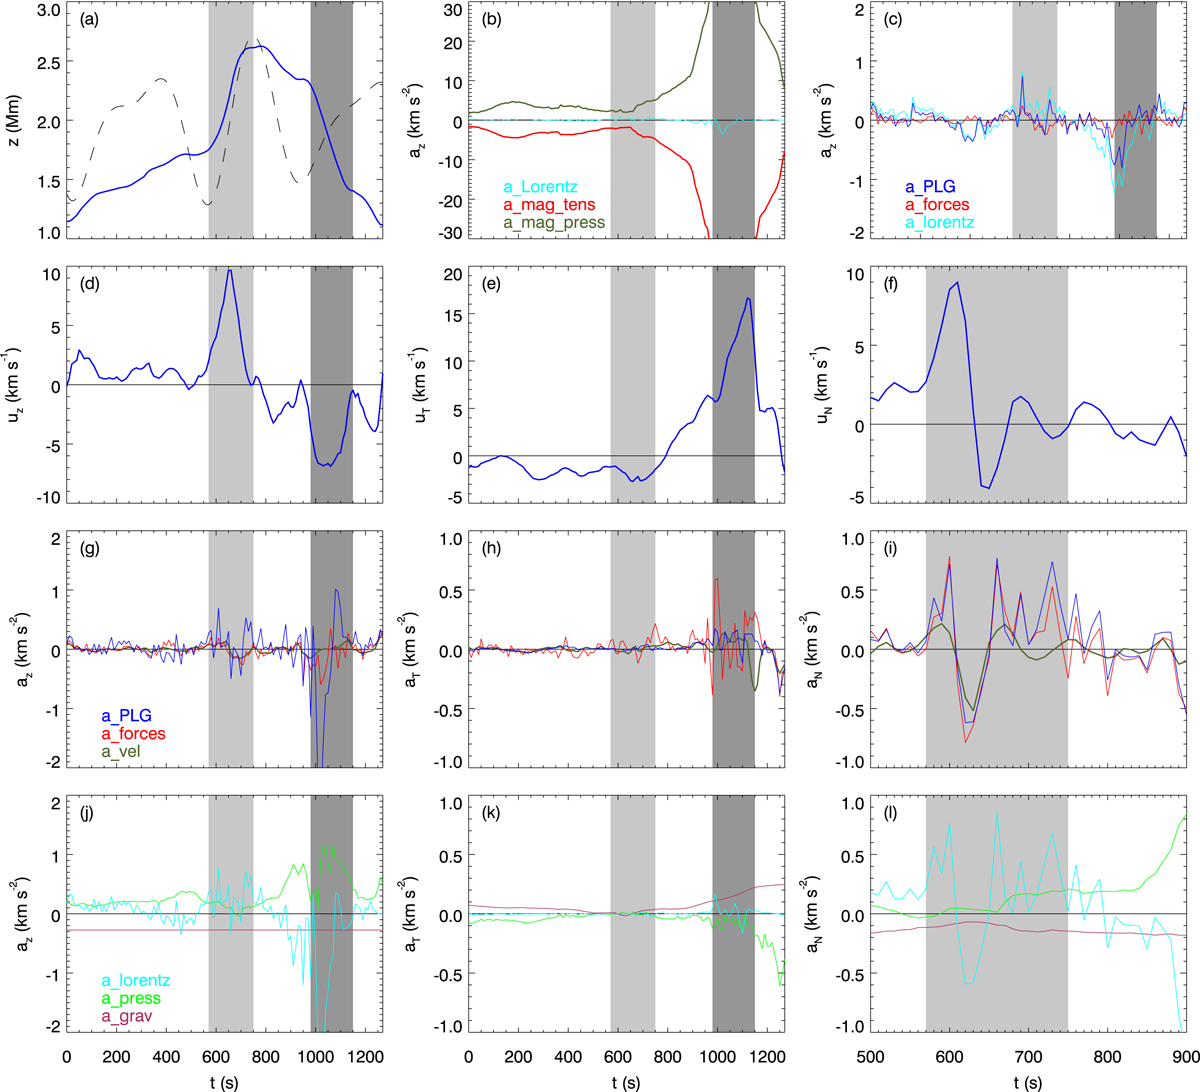
Positions, velocities, and accelerations for representative cork A in fibril 1 as functions of time. In each panel the cork formation period, defined by the upswing of the photospheric box oscillation, is shaded a lighter grey and the fibril destruction period is shown in a darker grey. Top row, left: cork position (solid), box oscillation for comparison (dashed, on an arbitrary scale); centre: vertical components of magnetic pressure and tension, along with their sum, the Lorentz force; right: additional panel only in this figure, showing vertical force components averaged over cork A and the two corks that were closest to it at the seed time. Second row: cork velocity with a vz = 0 line over-plotted for reference. Third row: cork acceleration computed for three different assumptions. Red: computed from all forces acting on the cork; blue: computed only from the Lorentz force, gas pressure gradient, and gravity; green: computed as the time derivative of the velocity in panel b. Fourth row: acceleration owing to the gas pressure gradient, the Lorentz force, and gravity, as well as their sum (aPLG). Left column: vertical direction. Middle column: direction tangential to the field line (the T-direction in the Frenet-Serret frame). Right column: direction normal to the field line (the N-direction).
Current usage metrics show cumulative count of Article Views (full-text article views including HTML views, PDF and ePub downloads, according to the available data) and Abstracts Views on Vision4Press platform.
Data correspond to usage on the plateform after 2015. The current usage metrics is available 48-96 hours after online publication and is updated daily on week days.
Initial download of the metrics may take a while.