Fig. 4.
Download original image
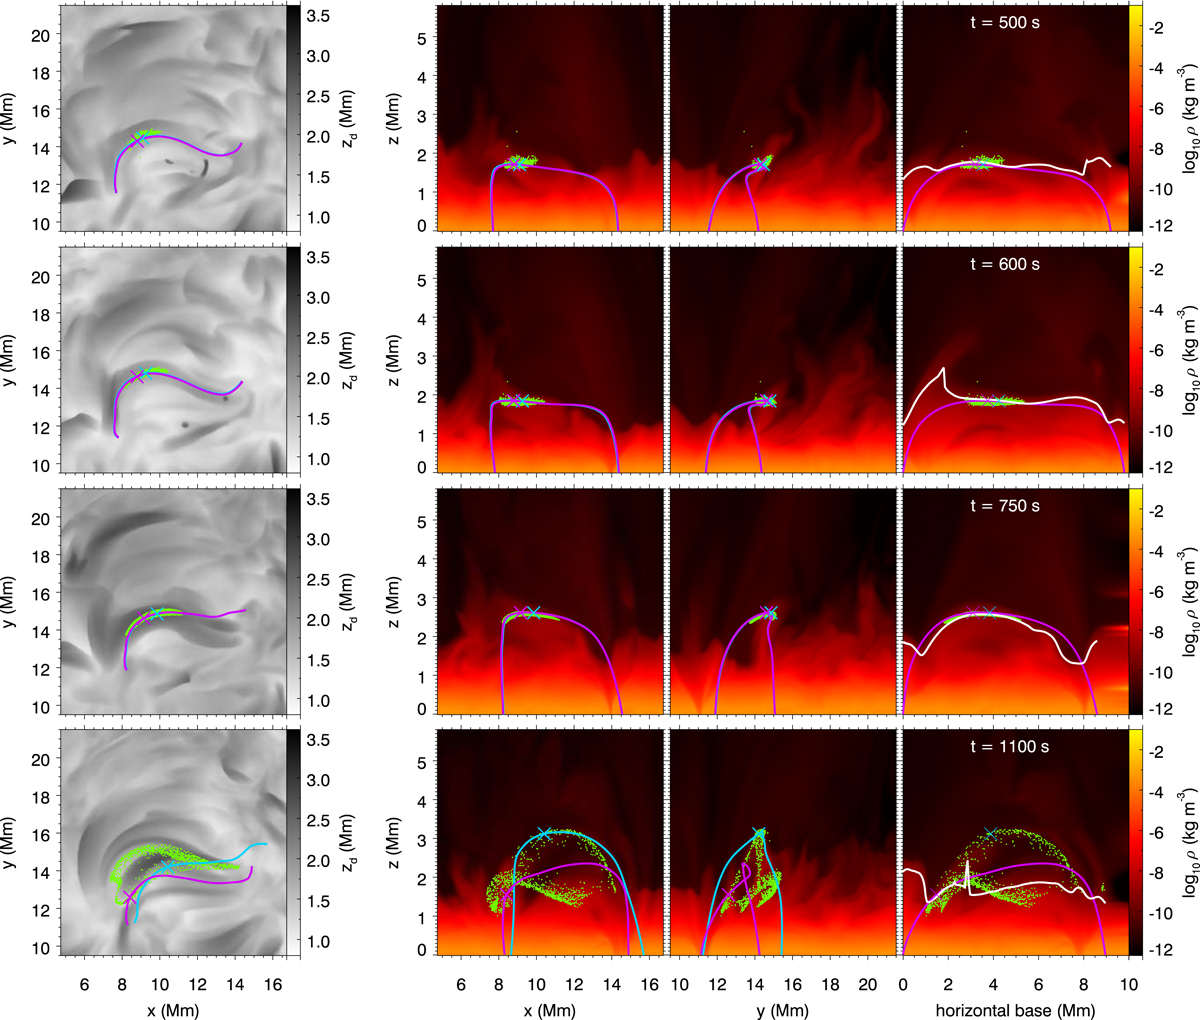
Time evolution of fibril 1. Rows show from top to bottom the time evolution of the fibril, with the time indicated in the rightmost panels. The first column shows an image of the Hα density proxy, the locations of the corks that make up the fibril at t = 750 s, and two magnetic field lines. The field lines are initially close together, but have drifted apart at t = 1100 s as seen in the bottom row, with the cork A and B locations (and their associated field lines) shown in magenta and cyan respectively. The second column shows the density in a vertical cut in the xz-plane, with the field lines and cork locations over-plotted. The third column shows the same as the second column, but for a yz-cut. The fourth column shows a similar vertical cut, but now traced along the xy-position of one of the field lines, with the representative Hα core formation height ‘z_d’ used for the Hα proxy images over-plotted using a white line. Movies are available online.
Current usage metrics show cumulative count of Article Views (full-text article views including HTML views, PDF and ePub downloads, according to the available data) and Abstracts Views on Vision4Press platform.
Data correspond to usage on the plateform after 2015. The current usage metrics is available 48-96 hours after online publication and is updated daily on week days.
Initial download of the metrics may take a while.