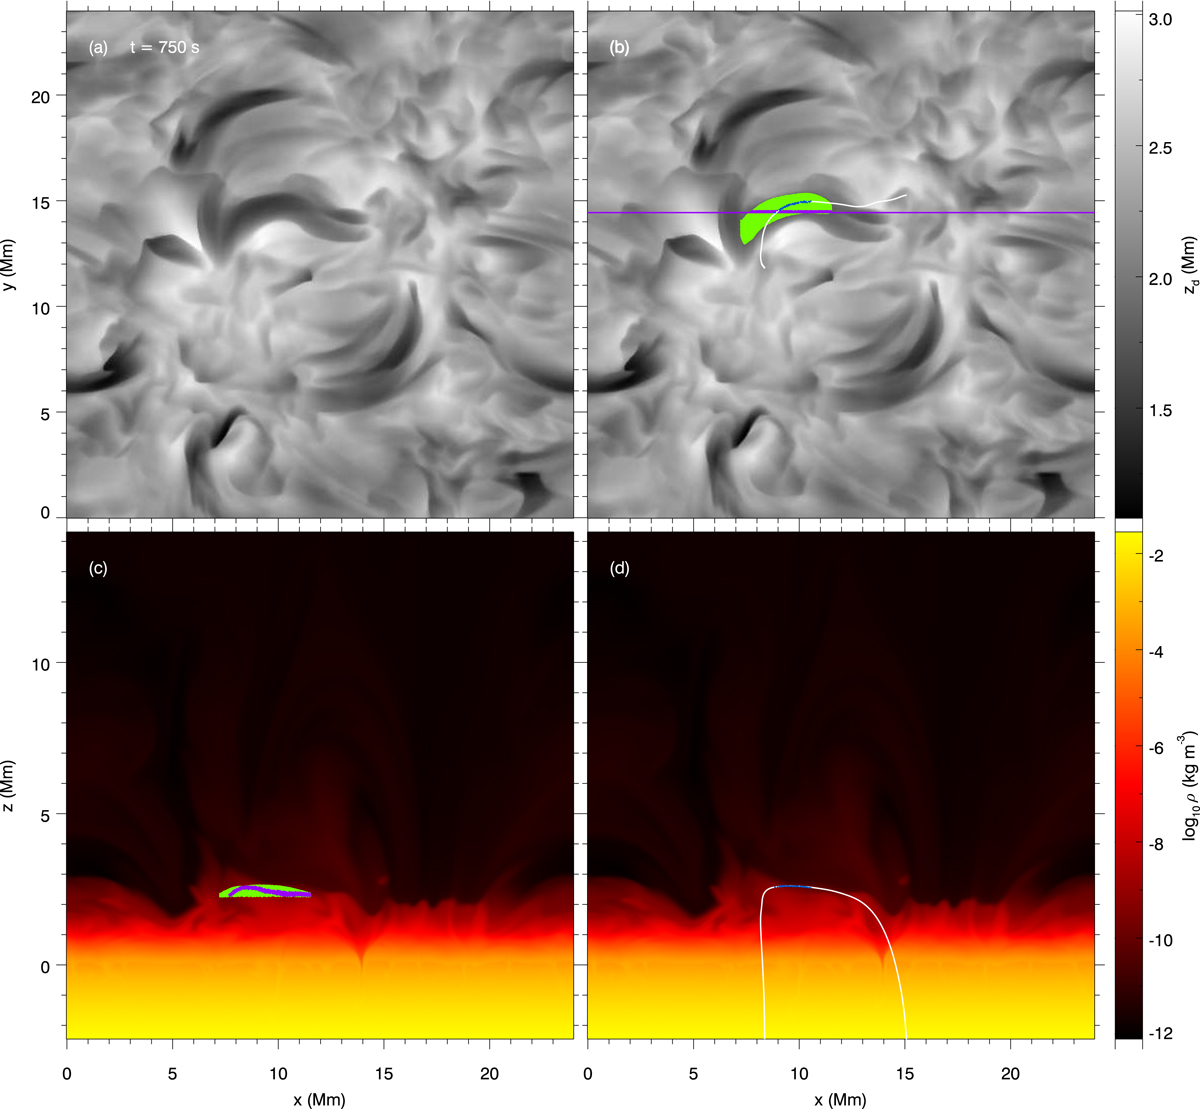
Fig. 3.
Download original image
Example of selection of corks in a fibril at t = 750 s. The Hα line intensity proxy is shown in panels a and b. Panels c and d: density in the xz-plane along the magenta line in panel b. The locations of all corks in a fibril are indicated in green, while the fibrilar corks located along the xz-cut are indicated in magenta in panel c. The white curve shows a magnetic field line passing through the fibril; fibrilar corks located on or very close to the field line are shown in blue.
Current usage metrics show cumulative count of Article Views (full-text article views including HTML views, PDF and ePub downloads, according to the available data) and Abstracts Views on Vision4Press platform.
Data correspond to usage on the plateform after 2015. The current usage metrics is available 48-96 hours after online publication and is updated daily on week days.
Initial download of the metrics may take a while.