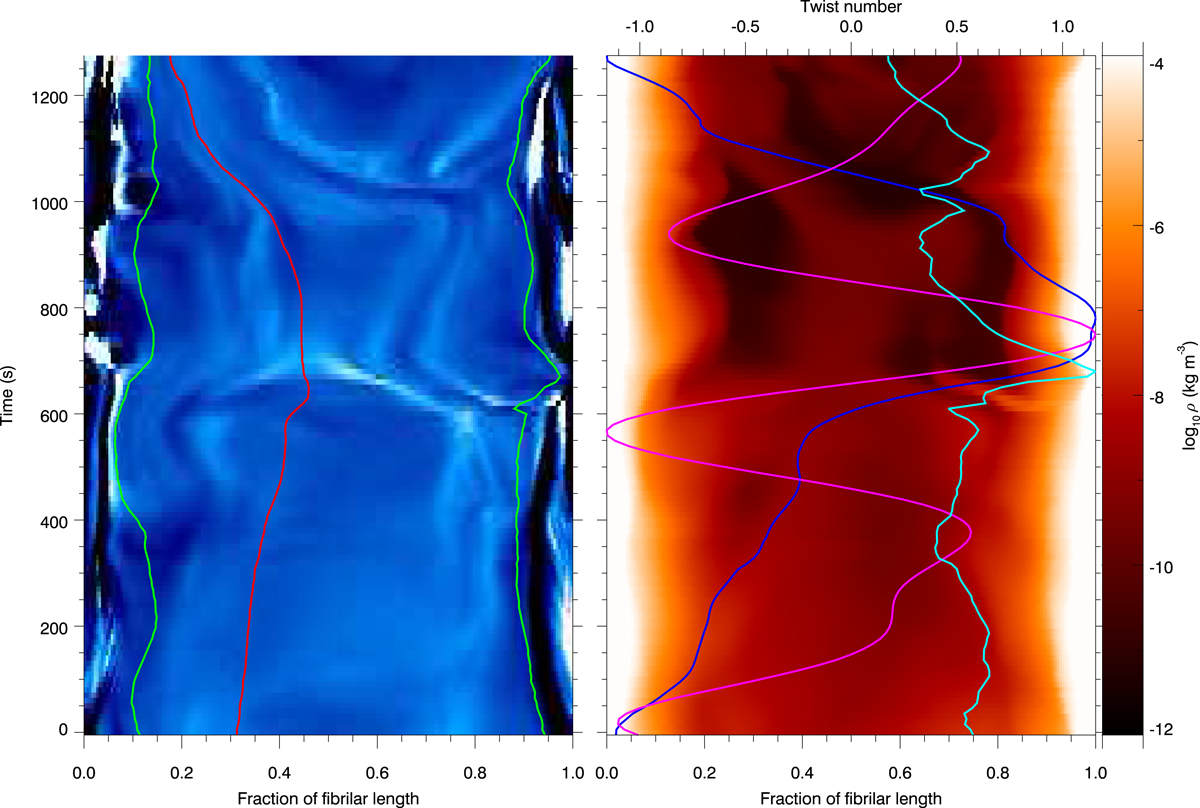
Fig. 16.
Download original image
Fibril formation map for fibril 1. Left: background image shows the twist parameter values along the field line length (x-axis. White shows positive values, black negative, and blue shows zero) for the field line that passed through cork F1A. The location of the cork along the field line is indicated by the red line. The outer green lines show the edges of the low β region, outside of which the twist parameter values are typically larger due to pressure dominating the motions (see the bands of dark and light outside of these green lines). Right: background image shows the logarithm of the plasma density, with over-plotted coloured lines that are not scaled similarly to the background image and each other in the x-direction. The magenta line shows the p-mode driven oscillations of the photosphere from Fig. 2, the blue line shows the vertical z-position of the cork chosen (see Fig. 5a). The cyan line shows the total integrated twist number along the field line, with its axis scaling shown at the top of the image.
Current usage metrics show cumulative count of Article Views (full-text article views including HTML views, PDF and ePub downloads, according to the available data) and Abstracts Views on Vision4Press platform.
Data correspond to usage on the plateform after 2015. The current usage metrics is available 48-96 hours after online publication and is updated daily on week days.
Initial download of the metrics may take a while.