Fig. 15.
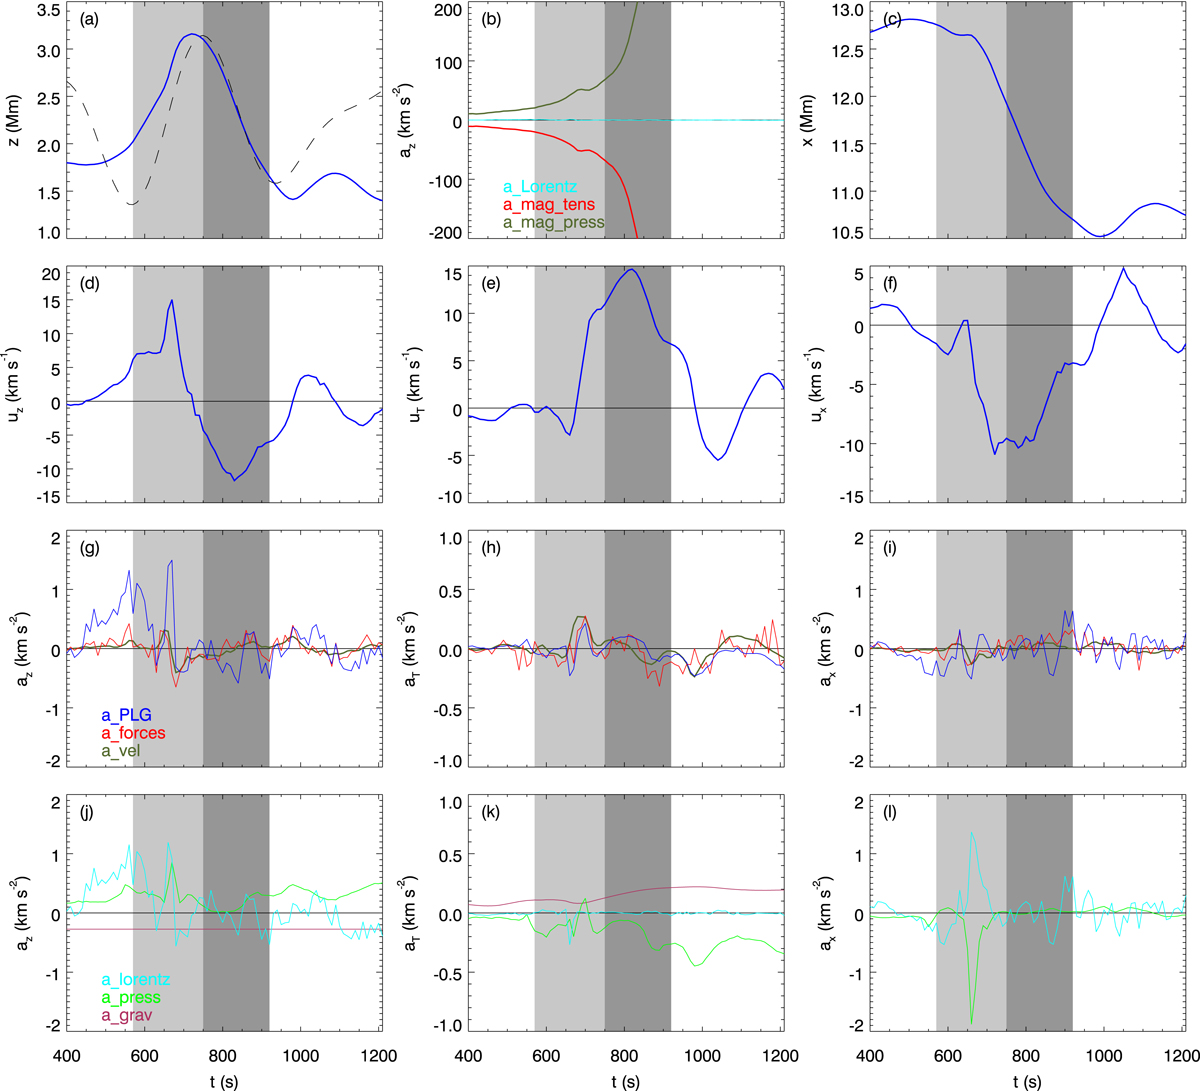
Download original image
Mean position, velocity, and acceleration in the z, T, and x directions for the 21 representative corks in fibril 3. Formatting as in Fig. 5, except for the right panels which show the x rather than the N component in order to discuss the horizontal plasma motions, and the time range is restricted to display the relevant time span.
Current usage metrics show cumulative count of Article Views (full-text article views including HTML views, PDF and ePub downloads, according to the available data) and Abstracts Views on Vision4Press platform.
Data correspond to usage on the plateform after 2015. The current usage metrics is available 48-96 hours after online publication and is updated daily on week days.
Initial download of the metrics may take a while.