Open Access
Fig. 8.
Download original image
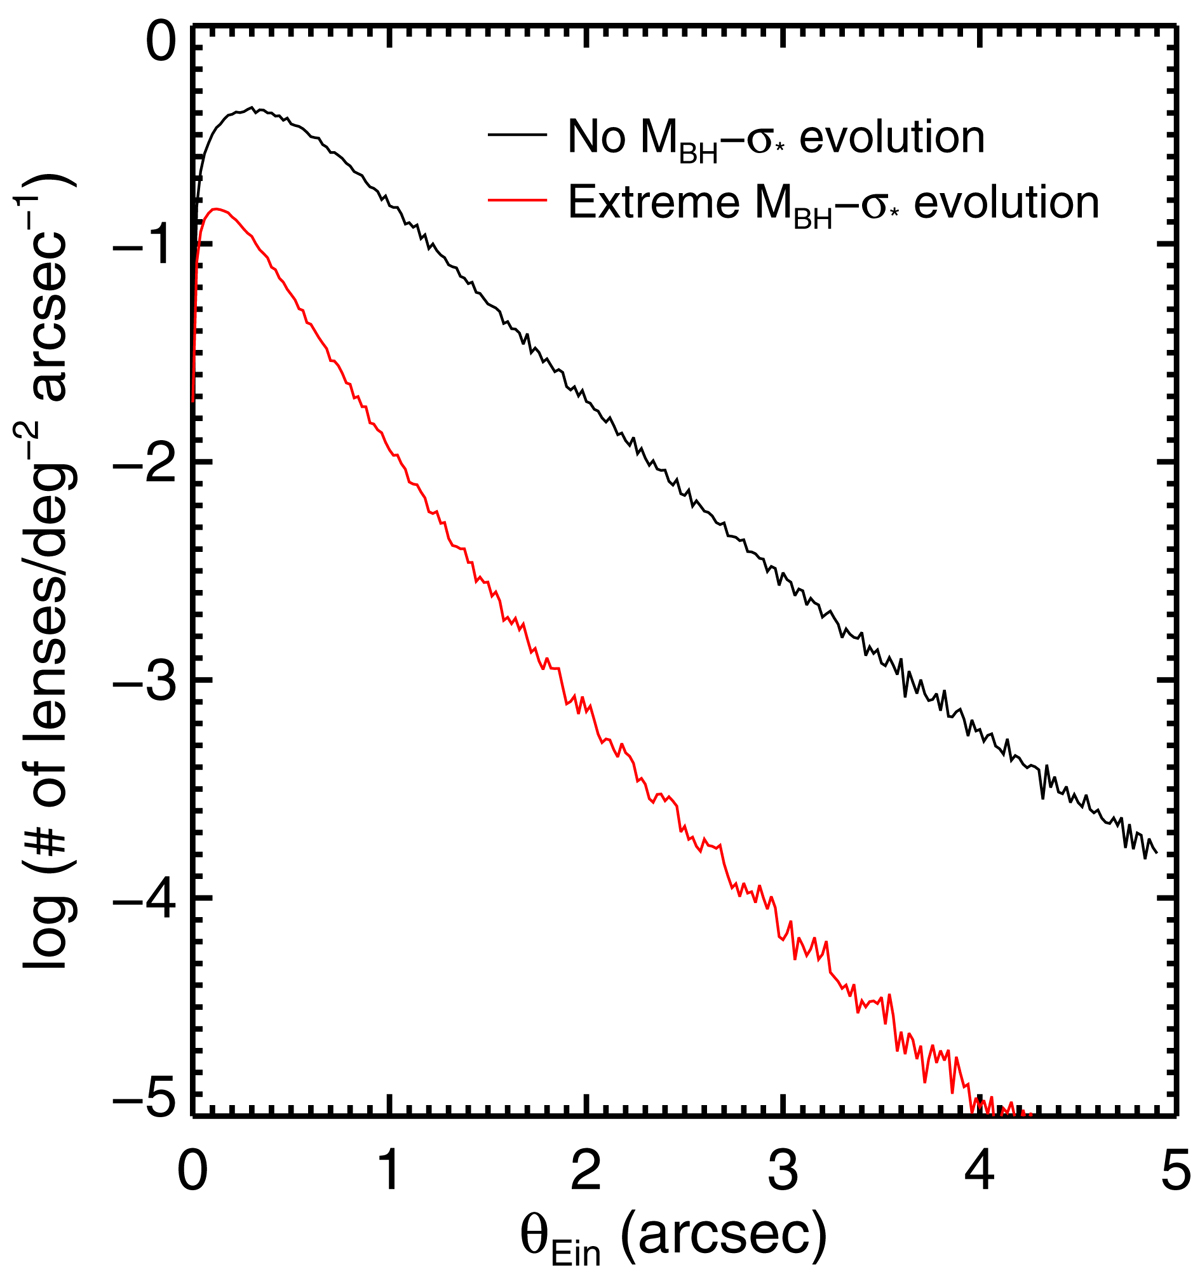
θEin distribution of QSO lenses for the limiting magnitude of HSC/Wide. Black and red lines denote the distributions for the no-evolution scenario and when there is an extreme evolution of the MBH − σ* relation, respectively. This figure is a rescaled version of Fig. 13 from Taak & Im (2020).
Current usage metrics show cumulative count of Article Views (full-text article views including HTML views, PDF and ePub downloads, according to the available data) and Abstracts Views on Vision4Press platform.
Data correspond to usage on the plateform after 2015. The current usage metrics is available 48-96 hours after online publication and is updated daily on week days.
Initial download of the metrics may take a while.