Fig. 7.
Download original image
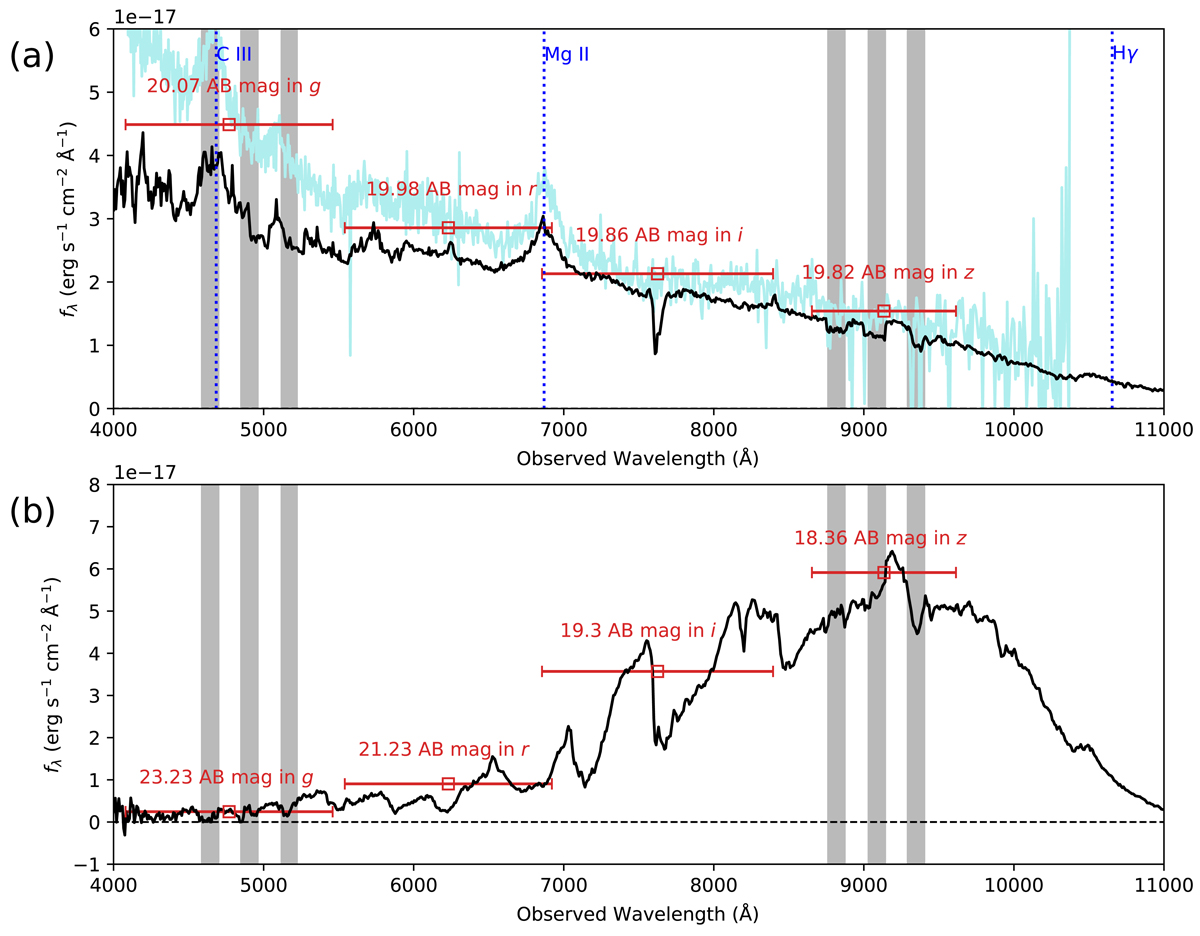
Gemini-N/GMOS spectra of SDSS J0002+0239 and SDSS J000216.35+023840.9. (a) Spectrum of SDSS J0002+0239. The GMOS spectrum is shown in black, and the SDSS spectrum is shown in turquoise. The vertical blue dashed lines indicate the wavelengths of the emission lines for z = 1.455, and the dark gray regions indicate the CCD gaps. Its magnitudes from SDSS are shown as red squares, with the error bars indicating filter widths. (b) Spectrum of SDSS J000216.35+023840.9, a star located ∼60″ southwest from the QSO. The horizontal black dashed line indicates zero flux. The dark gray regions, red squares, and the red error bars are identical to (a).
Current usage metrics show cumulative count of Article Views (full-text article views including HTML views, PDF and ePub downloads, according to the available data) and Abstracts Views on Vision4Press platform.
Data correspond to usage on the plateform after 2015. The current usage metrics is available 48-96 hours after online publication and is updated daily on week days.
Initial download of the metrics may take a while.