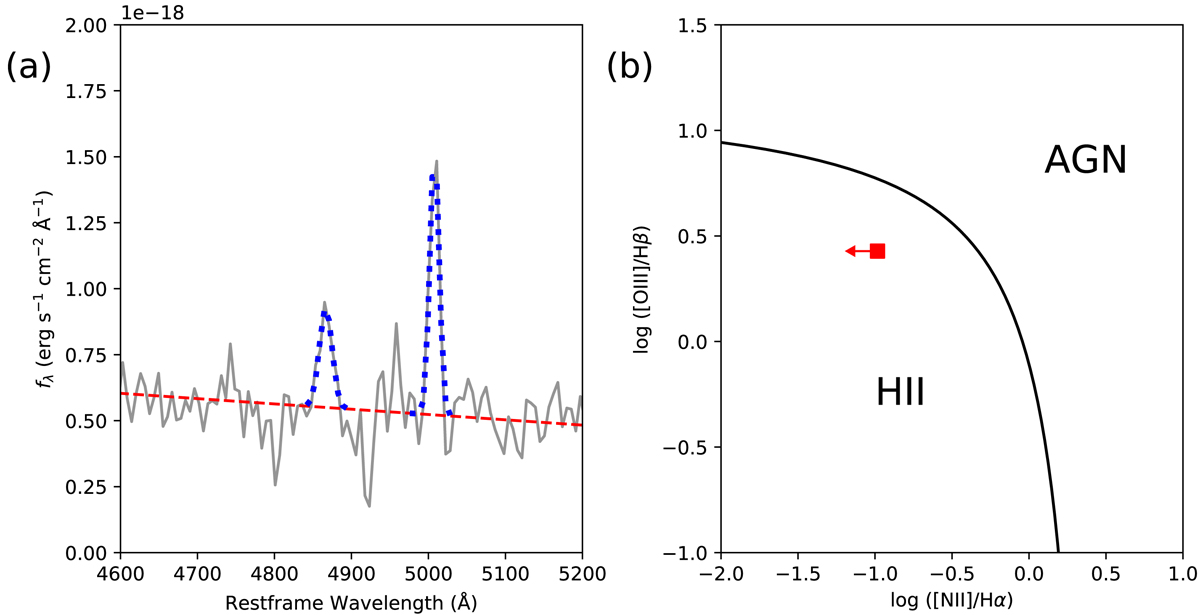
Fig. 6.
Download original image
Spectral analysis of object A. (a) Fitting results for the Hβ-region spectrum of object A. The spectrum is shown in gray, and the continuum and single-Gaussian emission line fits are shown with red dashed and blue dotted lines, respectively. (b) BPT diagram, with the line separating star-forming regions and AGNs from Kewley et al. (2006) shown in black. The red square represents object A, and the red arrow indicates the limit of the ratio.
Current usage metrics show cumulative count of Article Views (full-text article views including HTML views, PDF and ePub downloads, according to the available data) and Abstracts Views on Vision4Press platform.
Data correspond to usage on the plateform after 2015. The current usage metrics is available 48-96 hours after online publication and is updated daily on week days.
Initial download of the metrics may take a while.