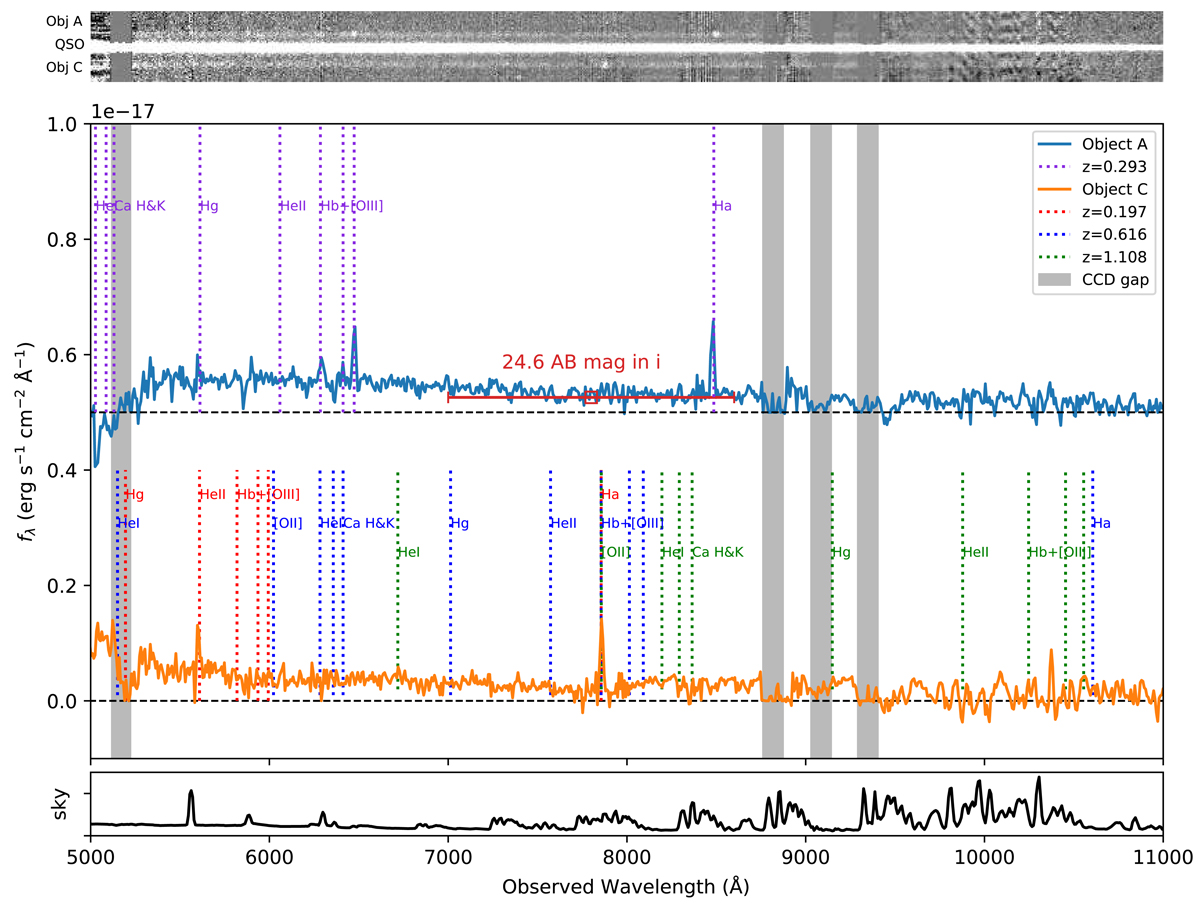
Fig. 5.
Download original image
Gemini-N/GMOS spectra of HULQ J0002+0239. Top panel: 2D spectra of the central QSO and the two objects. Center panel: spectra of the two objects, A and C. The spectra of objects A and C are shown in blue and orange, respectively. The spectra are offset by 0.5 × 10⁻¹⁷ erg s−1 cm−2 Å−1 for clarity, and the horizontal black dashed lines represent zero flux for each spectrum. The HSC i-band magnitude of object A is shown with a red square, with the horizontal error bars indicating the bandwidth. For object A, wavelengths of emission lines from an object at z = 0.293 are indicated with vertical purple dotted lines. For object C, wavelengths of emission lines from objects at z = 0.197, 0.616, and 1.108 are shown with vertical red, blue, and green dotted lines, respectively. These redshifts correspond to the redshifts of the source when the single strong emission line at ∼7860 Å corresponds to Hα, Hβ, and [O II], respectively. Vertical gray regions indicate the positions of the CCD gaps. Bottom panel: sky emission in arbitrary units.
Current usage metrics show cumulative count of Article Views (full-text article views including HTML views, PDF and ePub downloads, according to the available data) and Abstracts Views on Vision4Press platform.
Data correspond to usage on the plateform after 2015. The current usage metrics is available 48-96 hours after online publication and is updated daily on week days.
Initial download of the metrics may take a while.