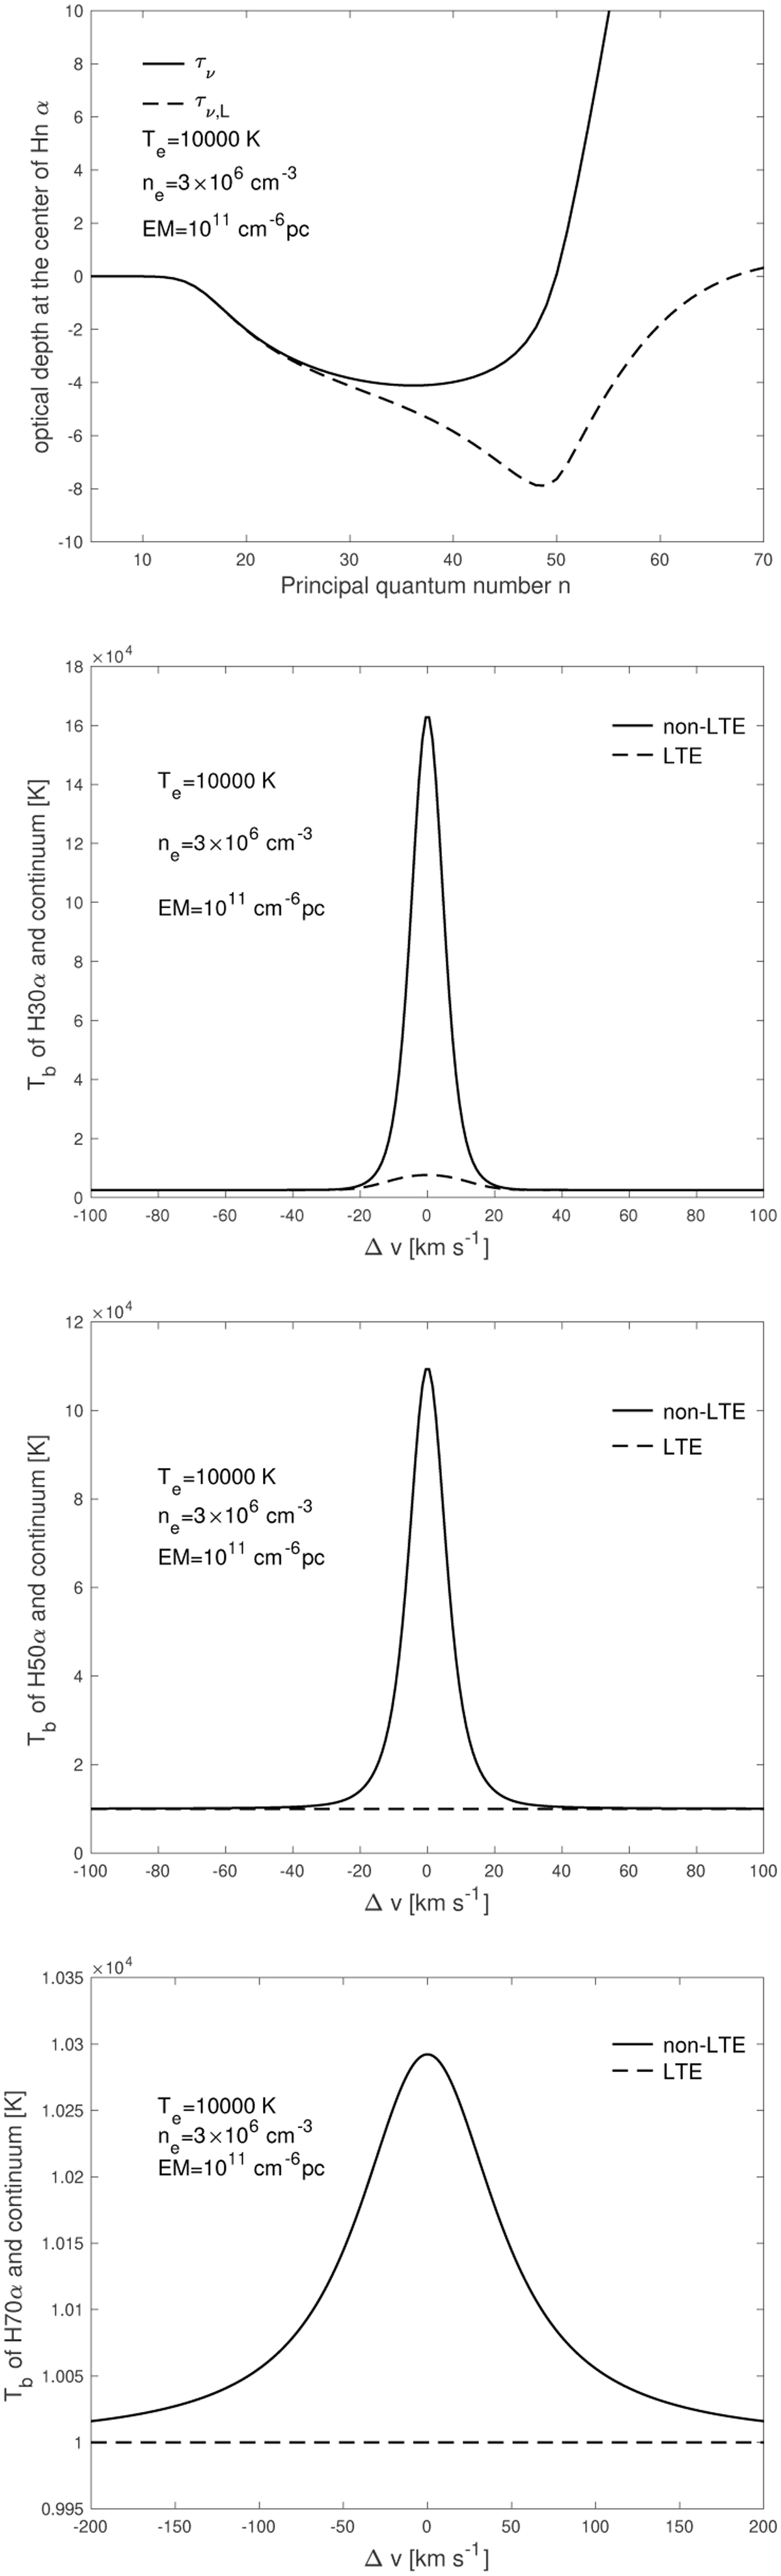
Fig. 8
Download original image
Relation between the line optical depth and the maser amplification. The total and line optical depths vs. the energy level n is displayed in the top panel. The brightness temperature Tb of the H30α, H50α, and H70α line profiles and the continuum is presented in the top middle, bottom middle, and bottom panels, respectively.
Current usage metrics show cumulative count of Article Views (full-text article views including HTML views, PDF and ePub downloads, according to the available data) and Abstracts Views on Vision4Press platform.
Data correspond to usage on the plateform after 2015. The current usage metrics is available 48-96 hours after online publication and is updated daily on week days.
Initial download of the metrics may take a while.