Fig. 6
Download original image
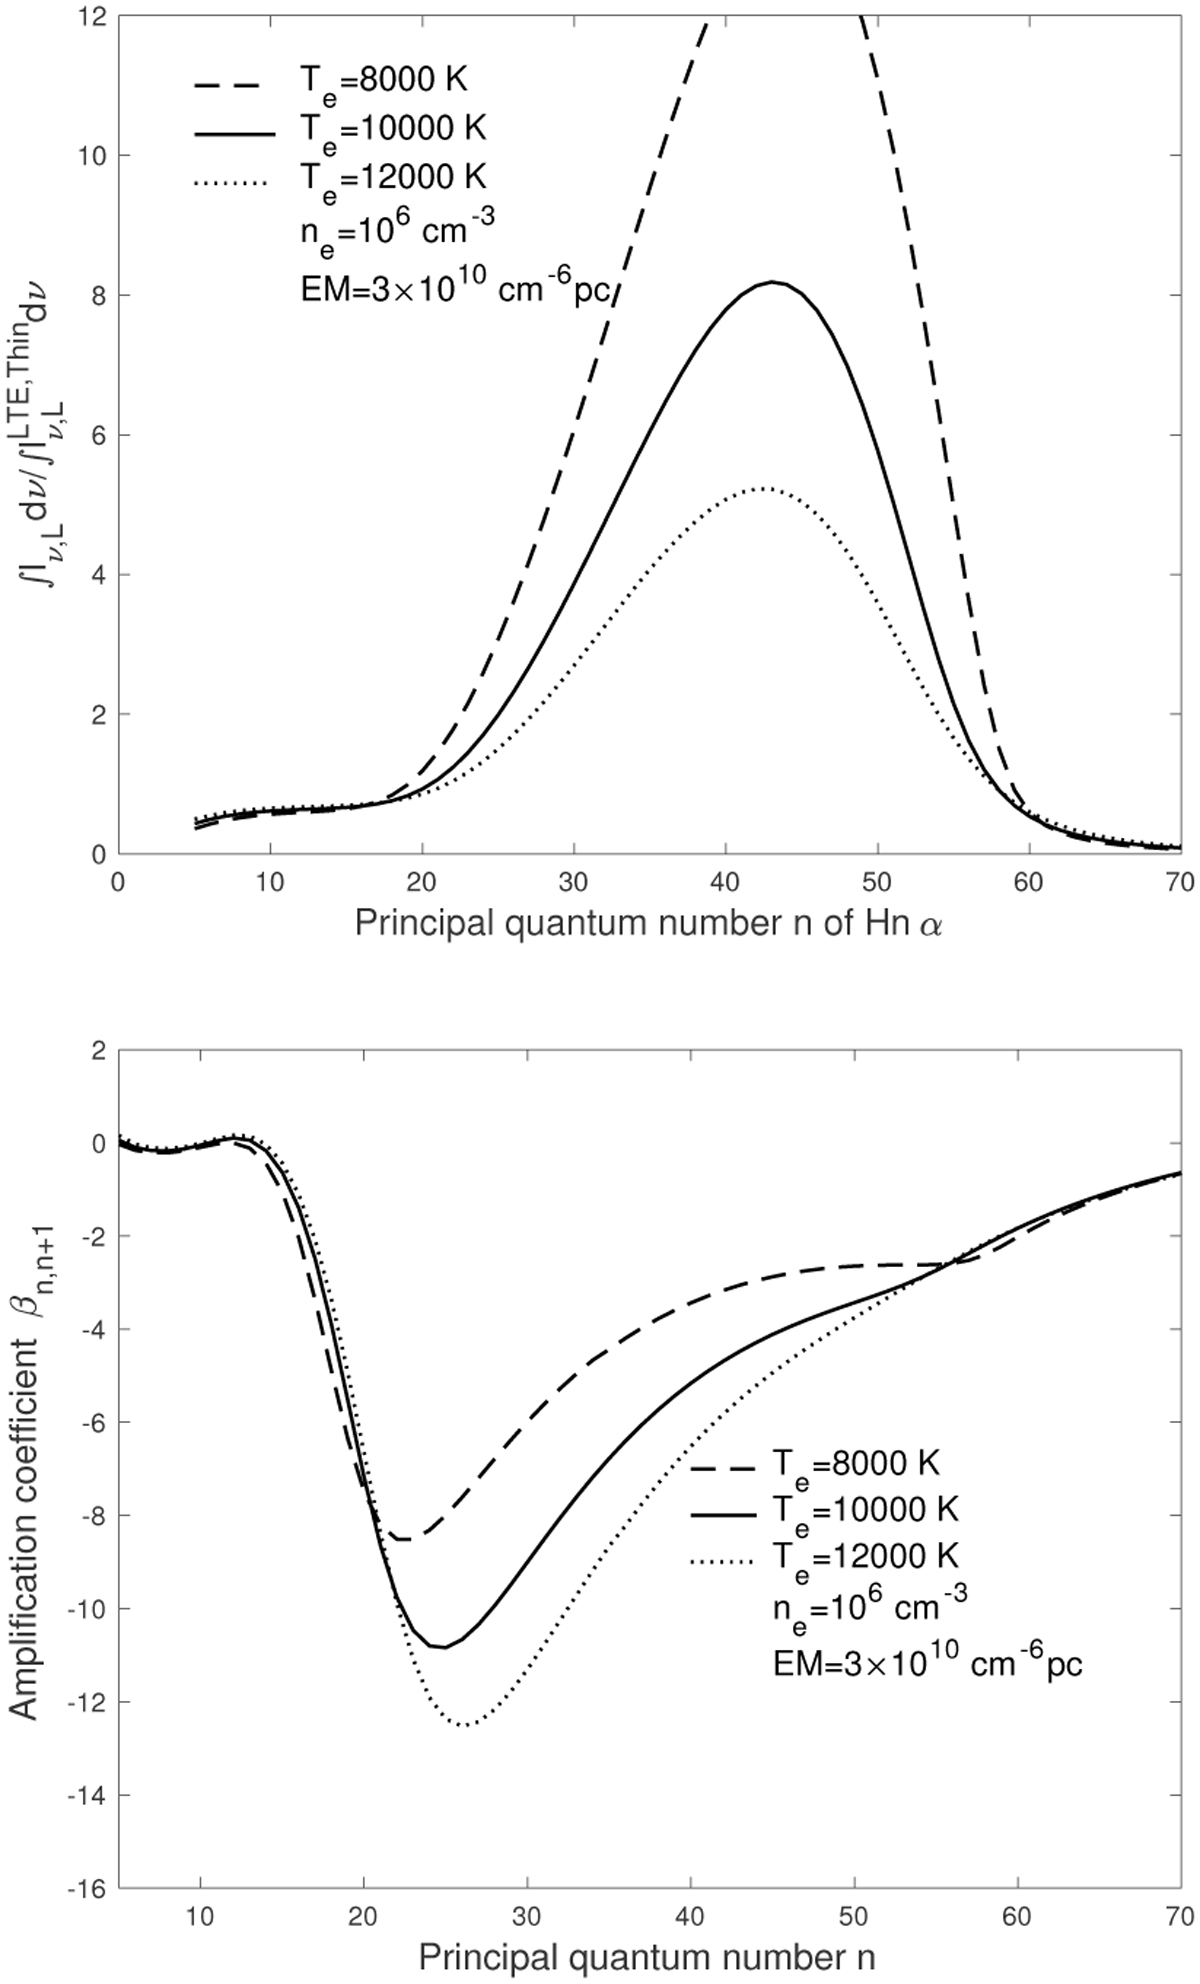
Hydrogen RRLs affected by different electron temperatures. In the top panel the ratios of the frequency-integrated line intensities ∫ Iv,Ldv to the intensities ![]() calculated under the LTE and optically thin assumptions for different electron temperatures are plotted. The corresponding amplification coefficientsvarying with the principal quantum number n are presented in the bottom panel.
calculated under the LTE and optically thin assumptions for different electron temperatures are plotted. The corresponding amplification coefficientsvarying with the principal quantum number n are presented in the bottom panel.
Current usage metrics show cumulative count of Article Views (full-text article views including HTML views, PDF and ePub downloads, according to the available data) and Abstracts Views on Vision4Press platform.
Data correspond to usage on the plateform after 2015. The current usage metrics is available 48-96 hours after online publication and is updated daily on week days.
Initial download of the metrics may take a while.