Fig. 4
Download original image
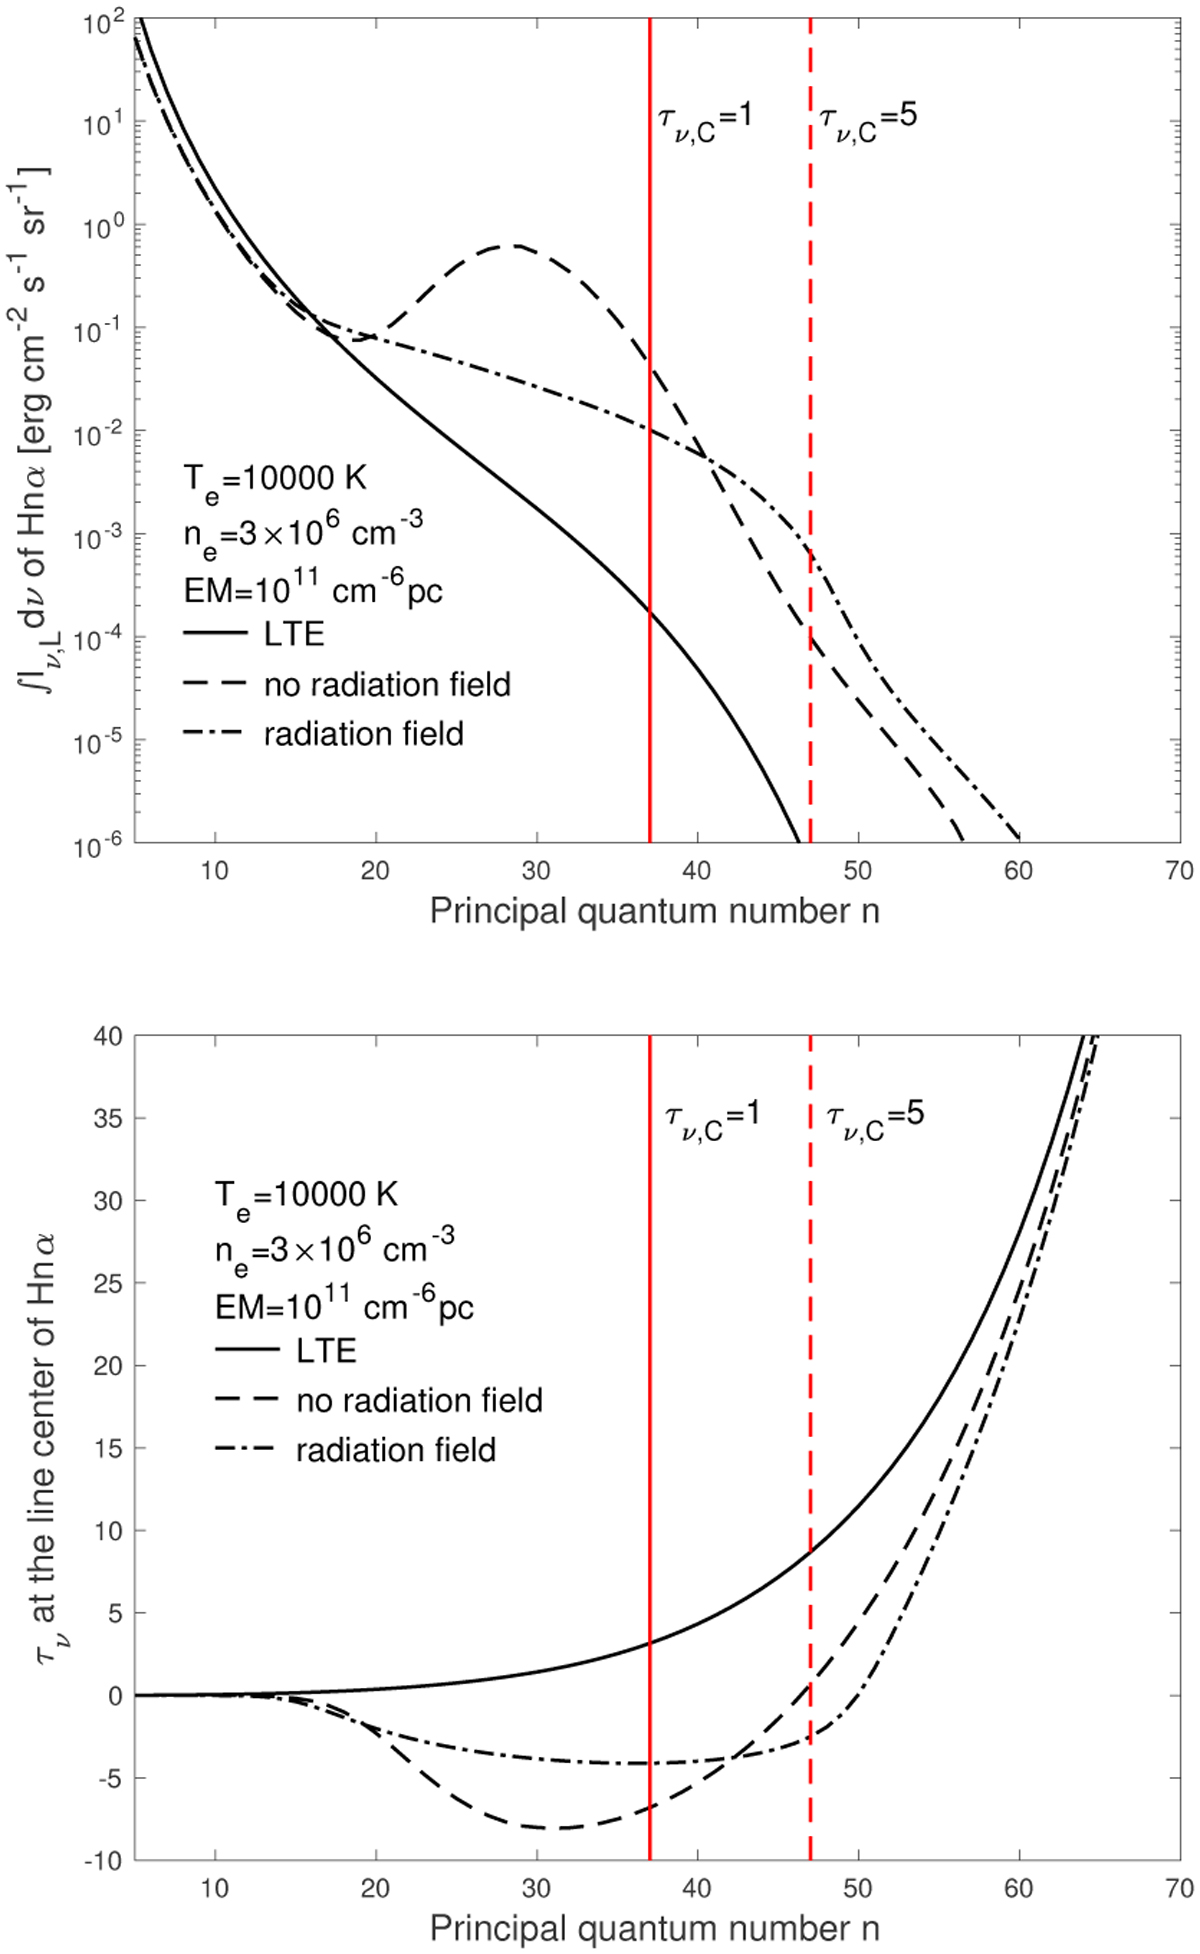
Effect of stimulation emission on hydrogen RRLs. The frequency-integrated intensities of the Hnα line calculated under LTE assumption (solid line) and using non-LTE method without and with the effect of radiation field on departure coefficients (dashed and dash-dotted line) vs. principal quantum number n are plotted in the top panel. The total optical depths at the frequencies of the Hnα lines are presented in the bottom panel. The red vertical lines indicate the positions of the continuum optical depth τvC = 1 and 5.
Current usage metrics show cumulative count of Article Views (full-text article views including HTML views, PDF and ePub downloads, according to the available data) and Abstracts Views on Vision4Press platform.
Data correspond to usage on the plateform after 2015. The current usage metrics is available 48-96 hours after online publication and is updated daily on week days.
Initial download of the metrics may take a while.