Fig. 3
Download original image
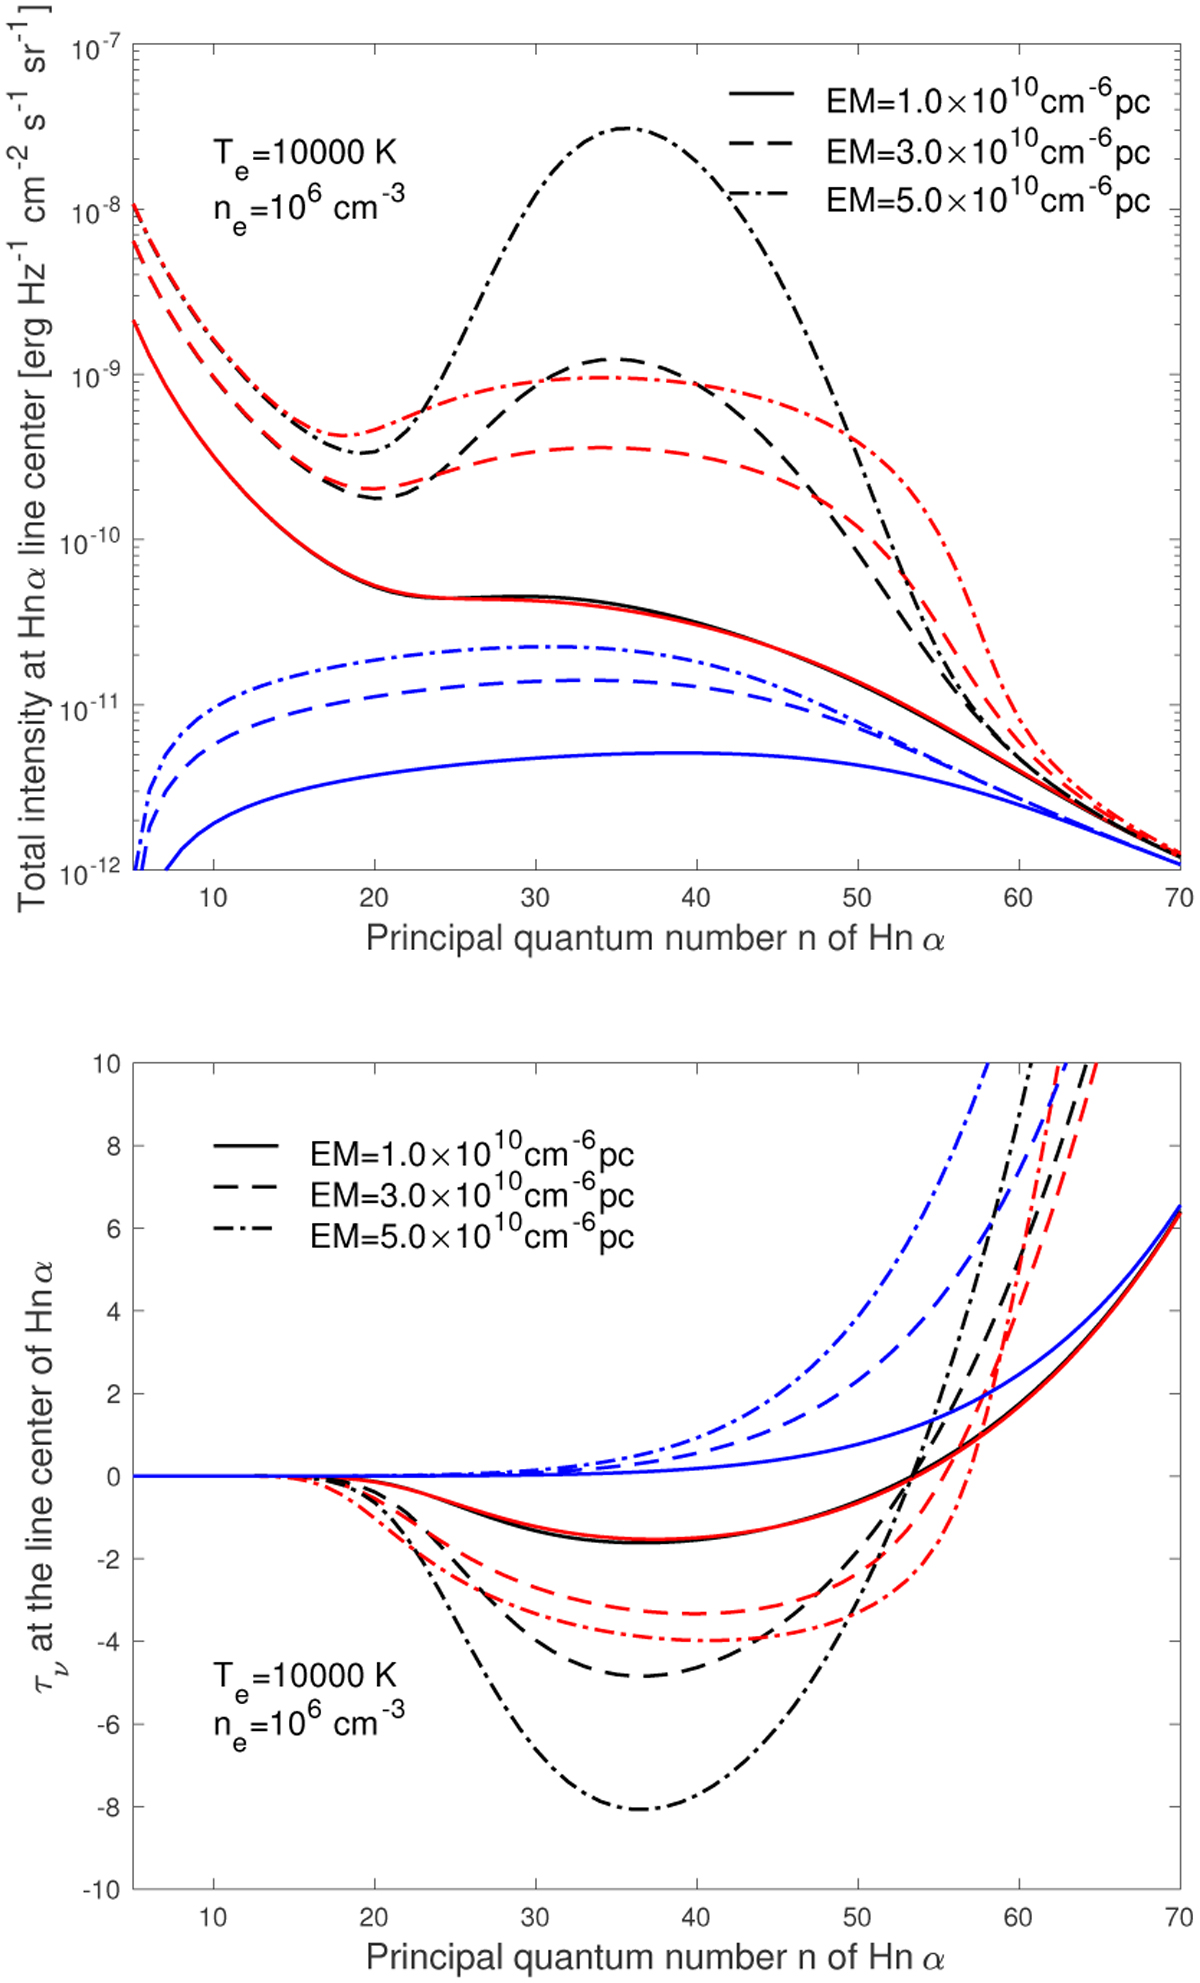
Influence of radiation fields on hydrogen RRLs. The total intensities at the frequencies of the Hnα line calculated with different EMs are plotted in the top panel. The total optical depths at the frequencies of the Hnα lines are presented in the bottom panel. The solid, dashed, and dash-dotted lines represent the values for EM = 1.0 × 10¹⁰, 3.0 × 10¹⁰, and 5.0 × 1010 cm−6 pc, respectively. The black lines represent the values calculated without the effect of radiation fields on level populations, and the red lines the values calculated with radiation fields. The blue lines show the values of the continuum emissions.
Current usage metrics show cumulative count of Article Views (full-text article views including HTML views, PDF and ePub downloads, according to the available data) and Abstracts Views on Vision4Press platform.
Data correspond to usage on the plateform after 2015. The current usage metrics is available 48-96 hours after online publication and is updated daily on week days.
Initial download of the metrics may take a while.