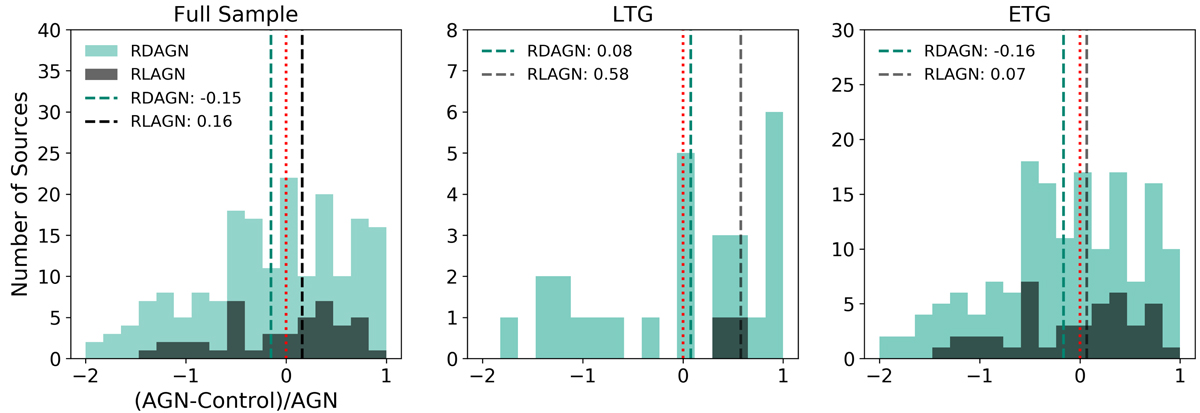
Fig. 7.
Download original image
Distribution for the fractional difference in the SFR as measured by Pipe3D of the RDAGN and its control galaxy for the entire sample, LTGs, and ETGs (green shading). The same values are also shown for the classical RLAGN subsample and its controls (black shading). The vertical, dashed lines represent the median of the distribution. A one-to-one line at zero is represented by the red, dotted line.
Current usage metrics show cumulative count of Article Views (full-text article views including HTML views, PDF and ePub downloads, according to the available data) and Abstracts Views on Vision4Press platform.
Data correspond to usage on the plateform after 2015. The current usage metrics is available 48-96 hours after online publication and is updated daily on week days.
Initial download of the metrics may take a while.