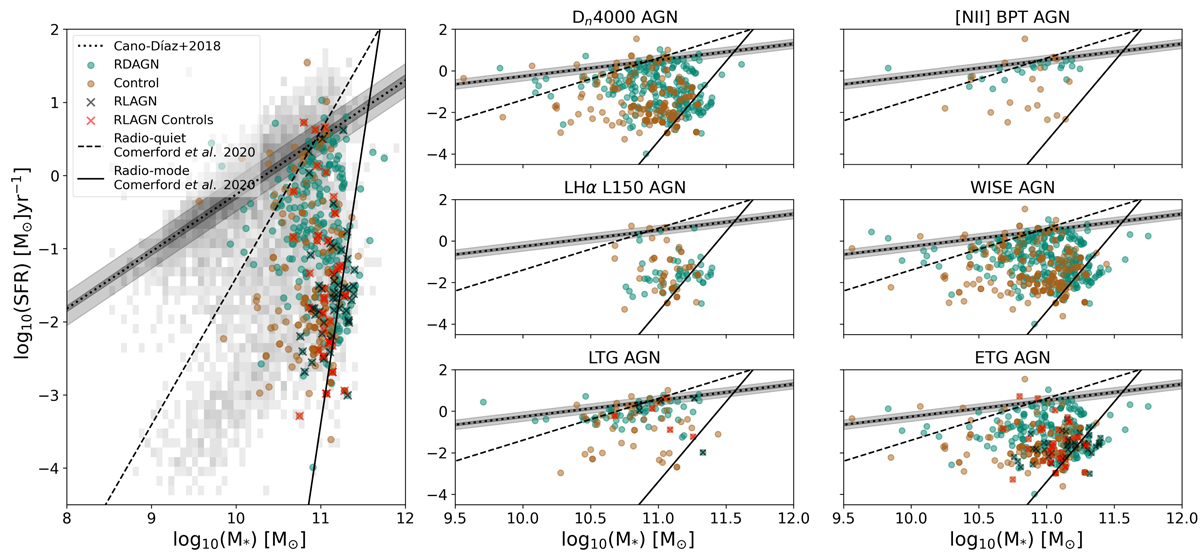
Fig. 6.
Download original image
Relation between SFR and M* for RDAGN host galaxies (green), the full control sample (brown), RLAGN subsample (black x’s), RLAGN control galaxies (red x’s), and entire Pipe3D catalog (gray). For reference, the SFMS derived for SDSS-IV MaNGA galaxies is indicated by the dotted line (Cano-Díaz et al. 2019), the dark gray shading represents the errors on slope, and the light gray shading represents the standard deviation. The best-fit relations for radio-quiet AGN (dashed line) and radio-mode AGN (solid line) are from Comerford et al. (2020).
Current usage metrics show cumulative count of Article Views (full-text article views including HTML views, PDF and ePub downloads, according to the available data) and Abstracts Views on Vision4Press platform.
Data correspond to usage on the plateform after 2015. The current usage metrics is available 48-96 hours after online publication and is updated daily on week days.
Initial download of the metrics may take a while.