Fig. 3.
Download original image
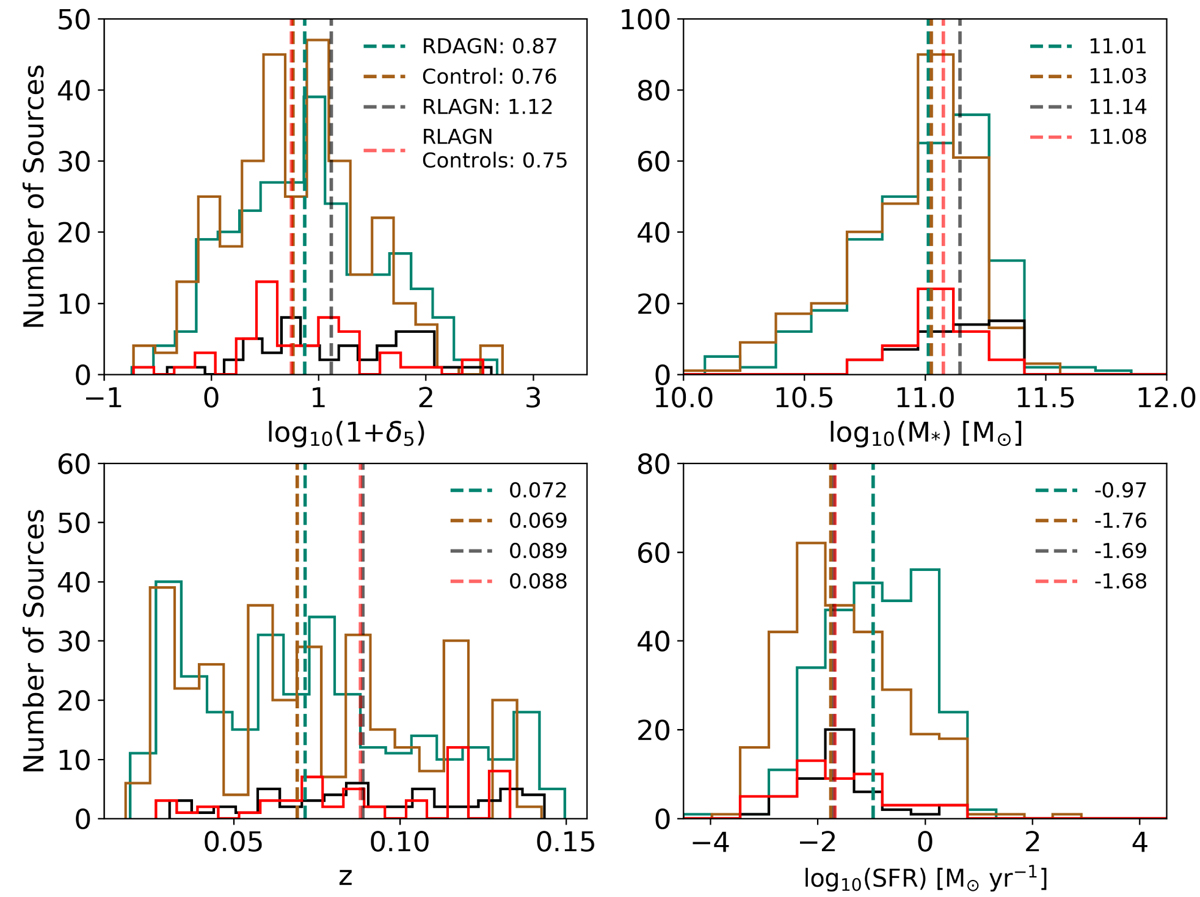
Distribution of measured properties of the RDAGN (green), control sample (brown), the classical RLAGN (black), and RLAGN control galaxies (red). The median value for each sample is indicated by the dashed, vertical lines. Top row from left to right: local galaxy overdensity evaluated at the fifth nearest neighbor (δ5), M*. Bottom row from left to right: z, SFR as measured by Pipe3D.
Current usage metrics show cumulative count of Article Views (full-text article views including HTML views, PDF and ePub downloads, according to the available data) and Abstracts Views on Vision4Press platform.
Data correspond to usage on the plateform after 2015. The current usage metrics is available 48-96 hours after online publication and is updated daily on week days.
Initial download of the metrics may take a while.