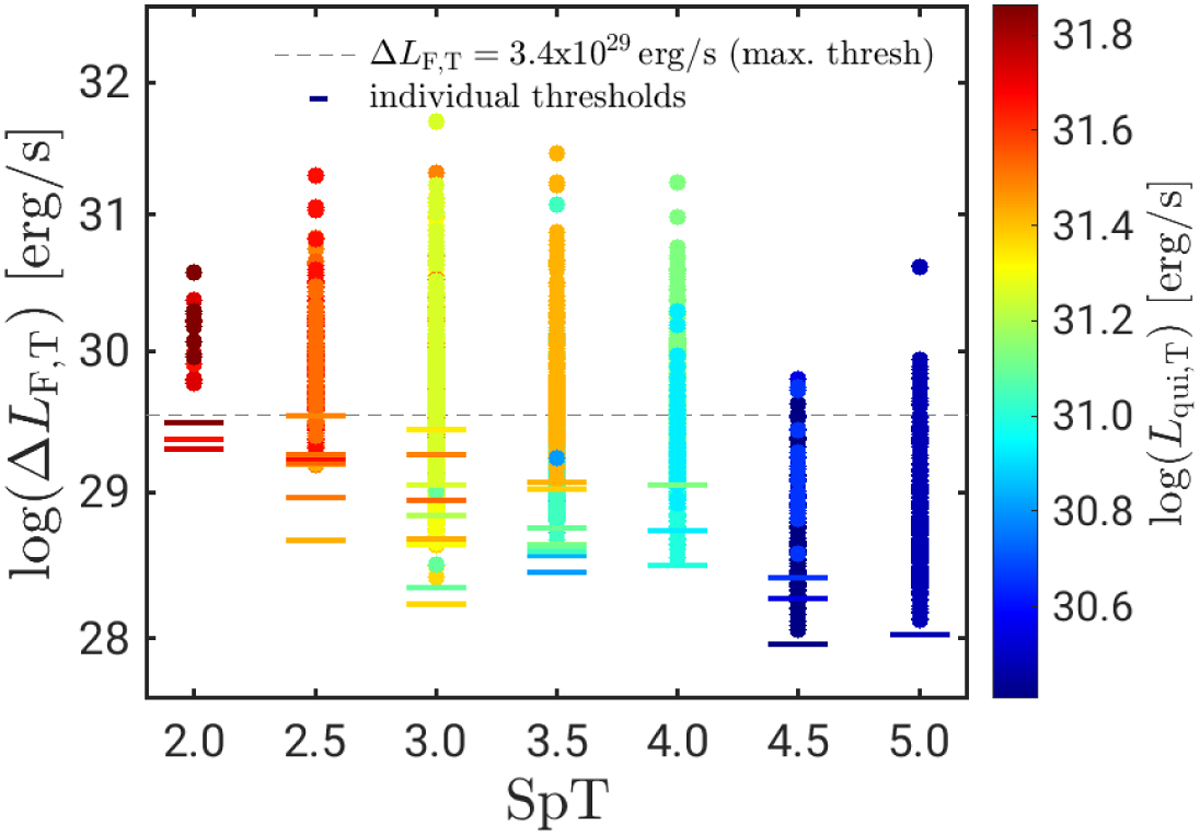
Fig. 8

Download original image
Relation between peak flare amplitude in the TESS band, ΔLf,t, and SpT. The minimum value of ΔLf,t that could be detected for each target is represented by a “_” marker. The gray dashed line marks the highest of the flare amplitude detection thresholds for all flaring stars in this sample of Lmax,th = 3.4 × 1029 erg s−1 (see Sect. 4.4). The color code visualizes the expected correlation between Lqui,T and SpT.
Current usage metrics show cumulative count of Article Views (full-text article views including HTML views, PDF and ePub downloads, according to the available data) and Abstracts Views on Vision4Press platform.
Data correspond to usage on the plateform after 2015. The current usage metrics is available 48-96 hours after online publication and is updated daily on week days.
Initial download of the metrics may take a while.


