Fig. 17

Download original image
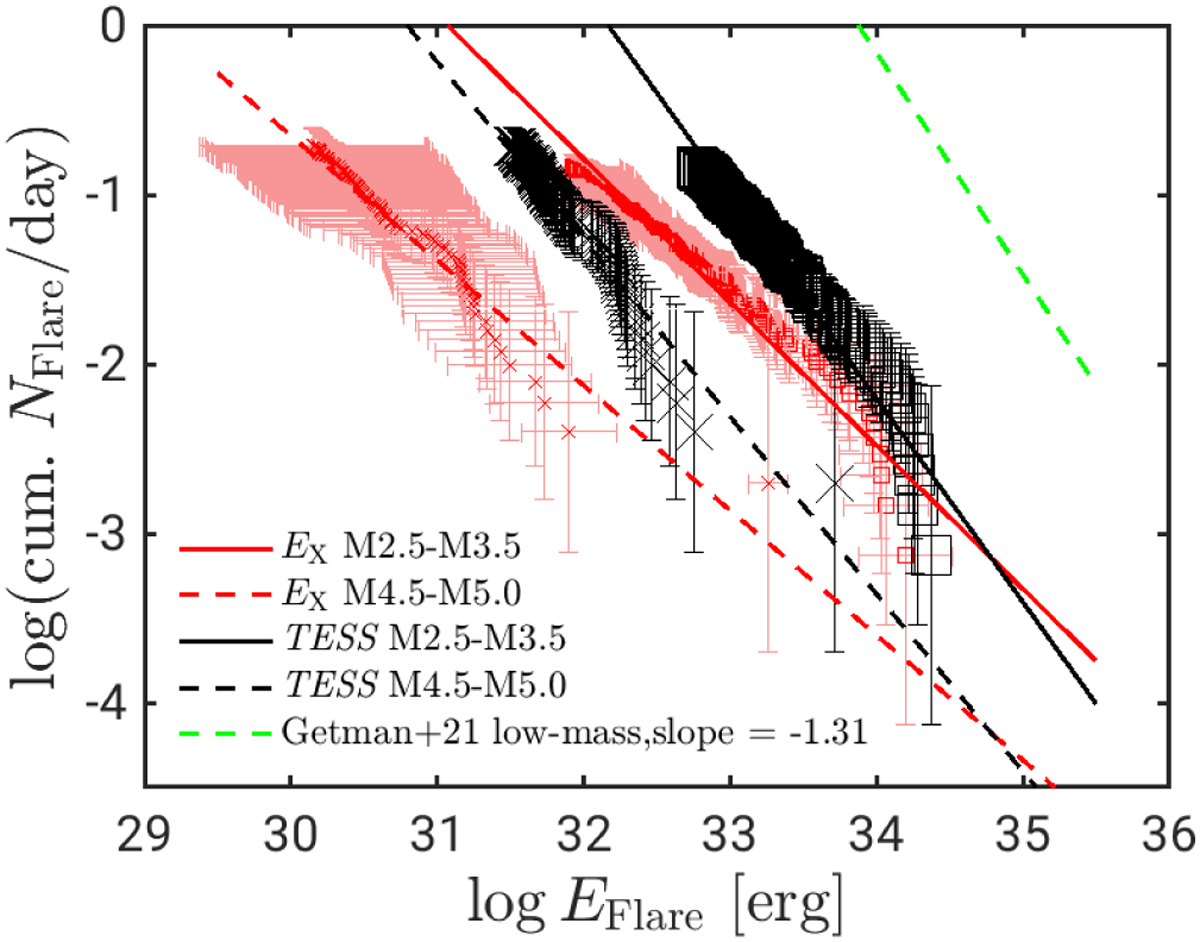
Average TESS FFDs for stars with reliable Prot in the early (M2.5–M3.5) and late (M4.5–M5) SpT range derived in Sect. 4.6 (black) and constructed X-ray FFDs based on the energy conversion derived in Sect. 5.1.3 (red). Error bars on EX represent the uncertainty caused by this conversion. Error bars on the flare rate are the same for the observed TESS (black) and constructed XMM-Newton (red) FFDs and result from Eq. (4). The green line represents the extrapolation to small flare energies for the observed X-ray FFD that Getman & Feigelson (2021) found for PMS stars with masses ≤1 M⊙. The slopes of our power law fits are given in Table 4.
Current usage metrics show cumulative count of Article Views (full-text article views including HTML views, PDF and ePub downloads, according to the available data) and Abstracts Views on Vision4Press platform.
Data correspond to usage on the plateform after 2015. The current usage metrics is available 48-96 hours after online publication and is updated daily on week days.
Initial download of the metrics may take a while.


